Local elections in Estonia
Tags:
#Estonia
About a month ago, on October 15th, Estonia held local elections for 79 municipalities. Insofar as they take place around the midpoint between national elections–the next are in 2019–the local elections are somewhat of a bellwether, like the US mid-term elections are. Accordingly a lot of the coverage in Estonia has focused on national-level results for the five major parties.
For anyone outside of Estonia, it is 2017 and the burning question of course is how well the local right-wing populists did. Especially since there may be the perception given the current state of affairs in countries like Hungary and Poland that Eastern Europe is not doing so well in this regard. This is what got me interested in the first place, although mostly for selfish reasons since I am a foreigner living in Estonia.
This post will dig into two questions:
- How did the major parties do at the municipal level?
- And specifically, how well did EKRE, the local populists, do?
A disclaimer before I start: I don’t think anything in here will be radically surprising to an Estonian reader. But I have lived here for three years now and have to admit that I knew very little about how elections work in Estonia before writing this post.
Background
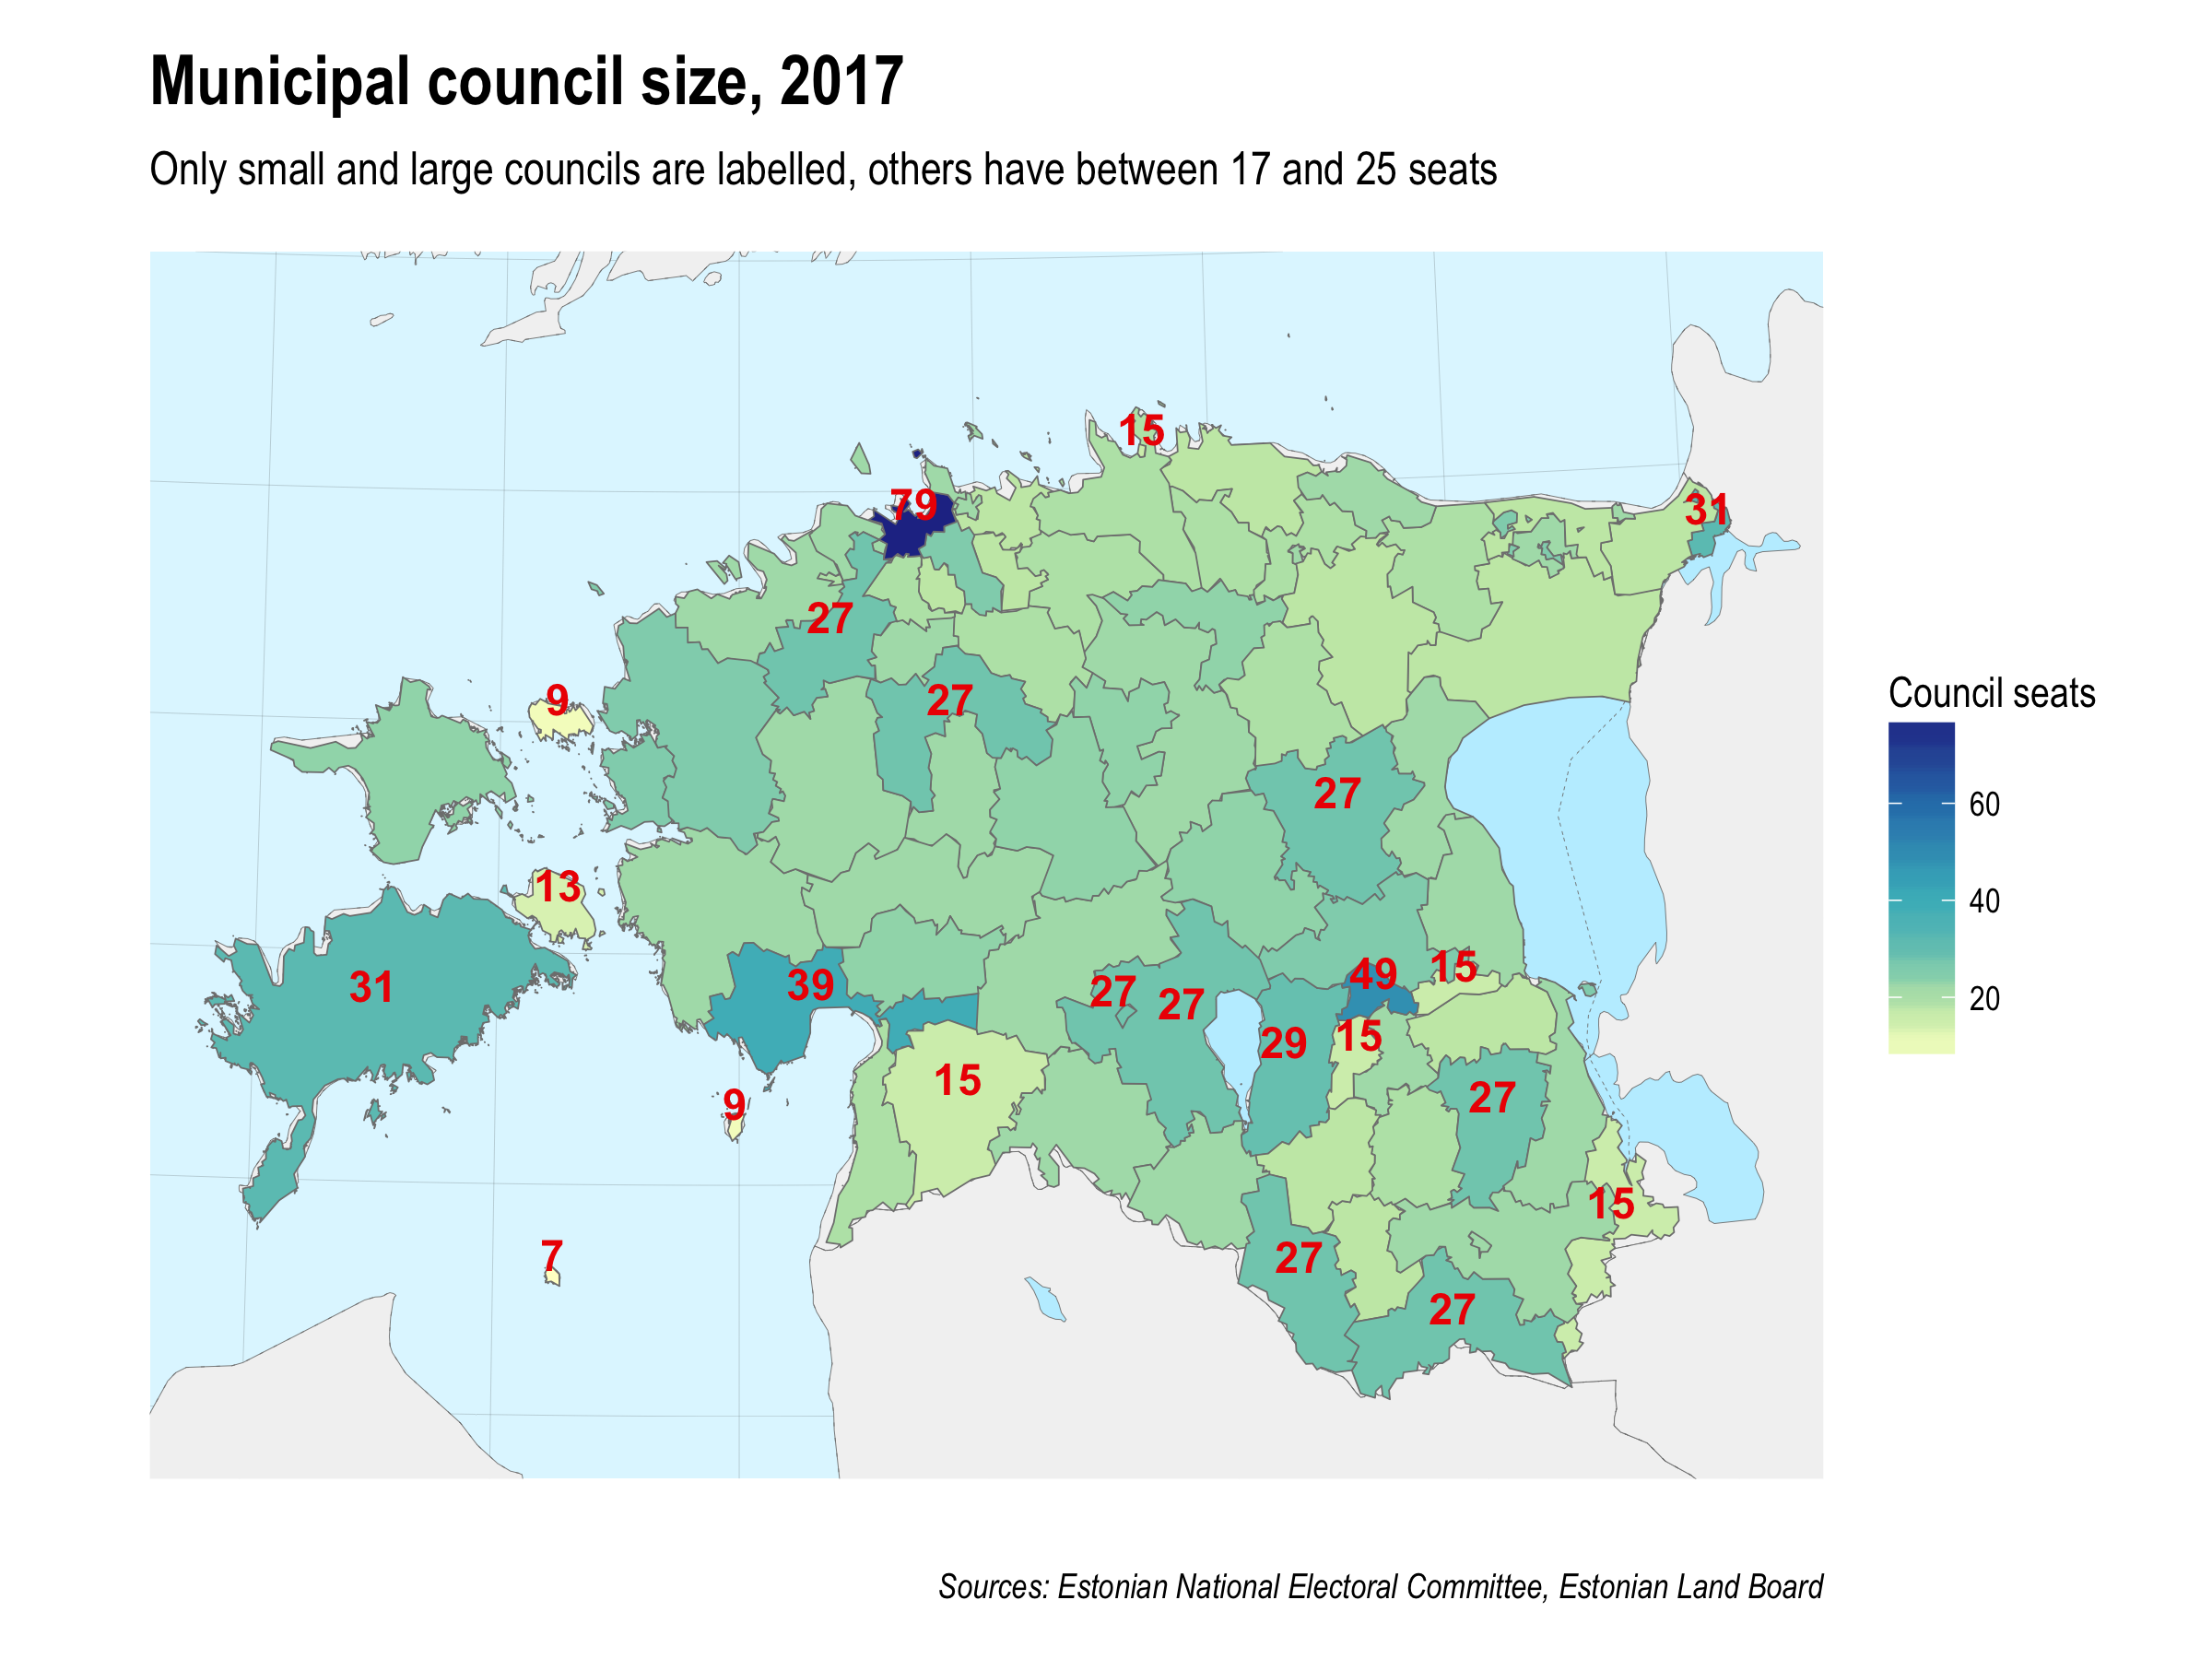
After the latest round of administrative reforms this year, the number of municipalities in Estonia was reduced from over 200 before to 79.1 The elections were for councils in each of those municipalities. The councils vary in size loosely in proportion to population, with a range of 7 to 79. Tallinn and Tartu, the two largest cities, have 79 and 49 member councils respectively; most other councils have between 17 and 25 members.
The elections use open-list proportional representation (PR) with a 5% electoral threshold. The Electoral Commission has a very informative explanation, and examples, for how it works. The experience of voting is not that different from how Americans vote. You cast your vote for one candidate, not a party per se, although you have a much broader range of candidates to vote for than the typical two in the US. And the candidates are grouped together in lists, which may represent parties or more temporary electoral alliances.
The big difference is in how winners are determined. Council seats are divvied up to the lists based on how many votes they each received in total, so that if a lists’ candidates together received 30% of the vote they should get roughly 30% of council seats. Provided the list had more than 5% of the vote, that is; if not it gets no seats. Also, candidates who get a lot of votes2 are directly elected to a seat, regardless of how well their list as a whole did.
Altogether there were 1,729 seats in 79 municipalities to be filled, and almost 12,000 candidates running for them.
The results
The Estonian Electoral Commission has a well-done website for the results of the 2017 election—and all prior elections as well actually—so I will just quickly go through the national level results here.
Estonia has five major national-level parties:
- Center Party, with stronger support among the Russian minority and pensioners; national governing party since 2016
- Reform Party, centre-right economic liberals who led government almost continuously between 2001 and 2016
- Social Democrats, centre-left
- IRL, center-right conservatives
- EKRE, right-wing populists
The Center Party obtained a majority of seats, 40 out of 79, in Tallinn. The city is by far Estonia’s largest, with about a third of the country’s population. That result is down from 46 seats in the last local elections in 2013.
Otherwise, at the national level the big changes were a crash in the vote for IRL and gains for EKRE, the right-wing populists. The table below summarizes the vote shares for the major parties as well as the various local parties and electoral coalitions, aggregated into the “Other parties/electoral alliances” category. The “Fielded candidates” column is the number of municipalities, out of 79, in which that party fielded candidates at all. Most parties did not run candidates in all 79 municipalities. The remaining columns in the table should be self-explanatory.
| Party | Vote % | Fielded Candidates | Seats | Plurality | Majority |
|---|---|---|---|---|---|
| Other parties/electoral alliances | 28.2 | 79 | 751 | ||
| Center Party | 27.3 | 73 | 297 | 11 | 6 |
| Reform Party | 19.5 | 54 | 291 | 16 | 6 |
| Social Democrats | 10.4 | 39 | 151 | 4 | 1 |
| IRL | 8.0 | 47 | 152 | 7 | 3 |
| EKRE | 6.7 | 50 | 87 | 0 | 0 |
#1: Local electoral coalitions and single candidates dominated the elections.
While all of the national parties participated in the local elections, a large chunk of the candidates were from one of more than 150 local electoral alliances, or ran as independent candidates. Edgar Savisaar, former head of the Center Party and major of Tallinn, for example, ran in Tallinn under an independent list rather than as part of the Center Party list. Collectively they received the highest vote share.
The various local electoral coalitions and single candidates ended up filling 43% of legislative council seats. They also ran a disproportionate share of the total number of candidates.
On a tangent, among the 150+ local lists, was one, in Antsla vald, with the name “Me elame siin”—“We live here” in English. Maybe that’s a reference to absentee officials who run as candidates there but actually live elsewhere like in Tallinn?
And the longest name belonged to “Voices”, a list catering to foreigners with the right to vote in local elections. That would be either resident EU citizens or foreigners with a permanent residence permit that one can get after 5 years. Their full name is:
Valimisliit Hääled - international and local voices for the prosperous future of Tallinn/rahvusvahelised ja kohalikud hääled Tallinna õitsva tuleviku jaoks
That’s 20 words and 155 characters in total. They managed to get 108 votes in Tallinn.
#2: Out of the national parties, the Reform Party had the best bang for their buck.
While more is always better, generally I think the incentives for these elections are like this:
- getting in below the 5% threshold is bad since you get no seats at all; any resources spent here have a short-term return of zero
- enough vote share to get a plurality of seats is good since it likely means you will head a coalition governing the municipality
- getting in at 50% or more is great since it guarantees running the local council and without the need for a coalition
- but much more than 50% doesn’t really provide any extra benefit, so if any resources were spent to get above that level they are also a waste
So the sweet spot is between 5% and around 50% of votes, leaning more towards enough for a plurality or even majority. In these terms, the Reform Party had the best bang for their buck. In the municipalities in which they ran candidates, they tended to do well. In only 2 did they fail to cross the 5% threshold, and often they did well enough to end up with the biggest vote share. Although they had overall 7 percentage points less vote share than the Center Party and ran candidates in 20 less municipalities, they won almost as many local council seats and actually ended up with a plurality in more than the Center Party did.
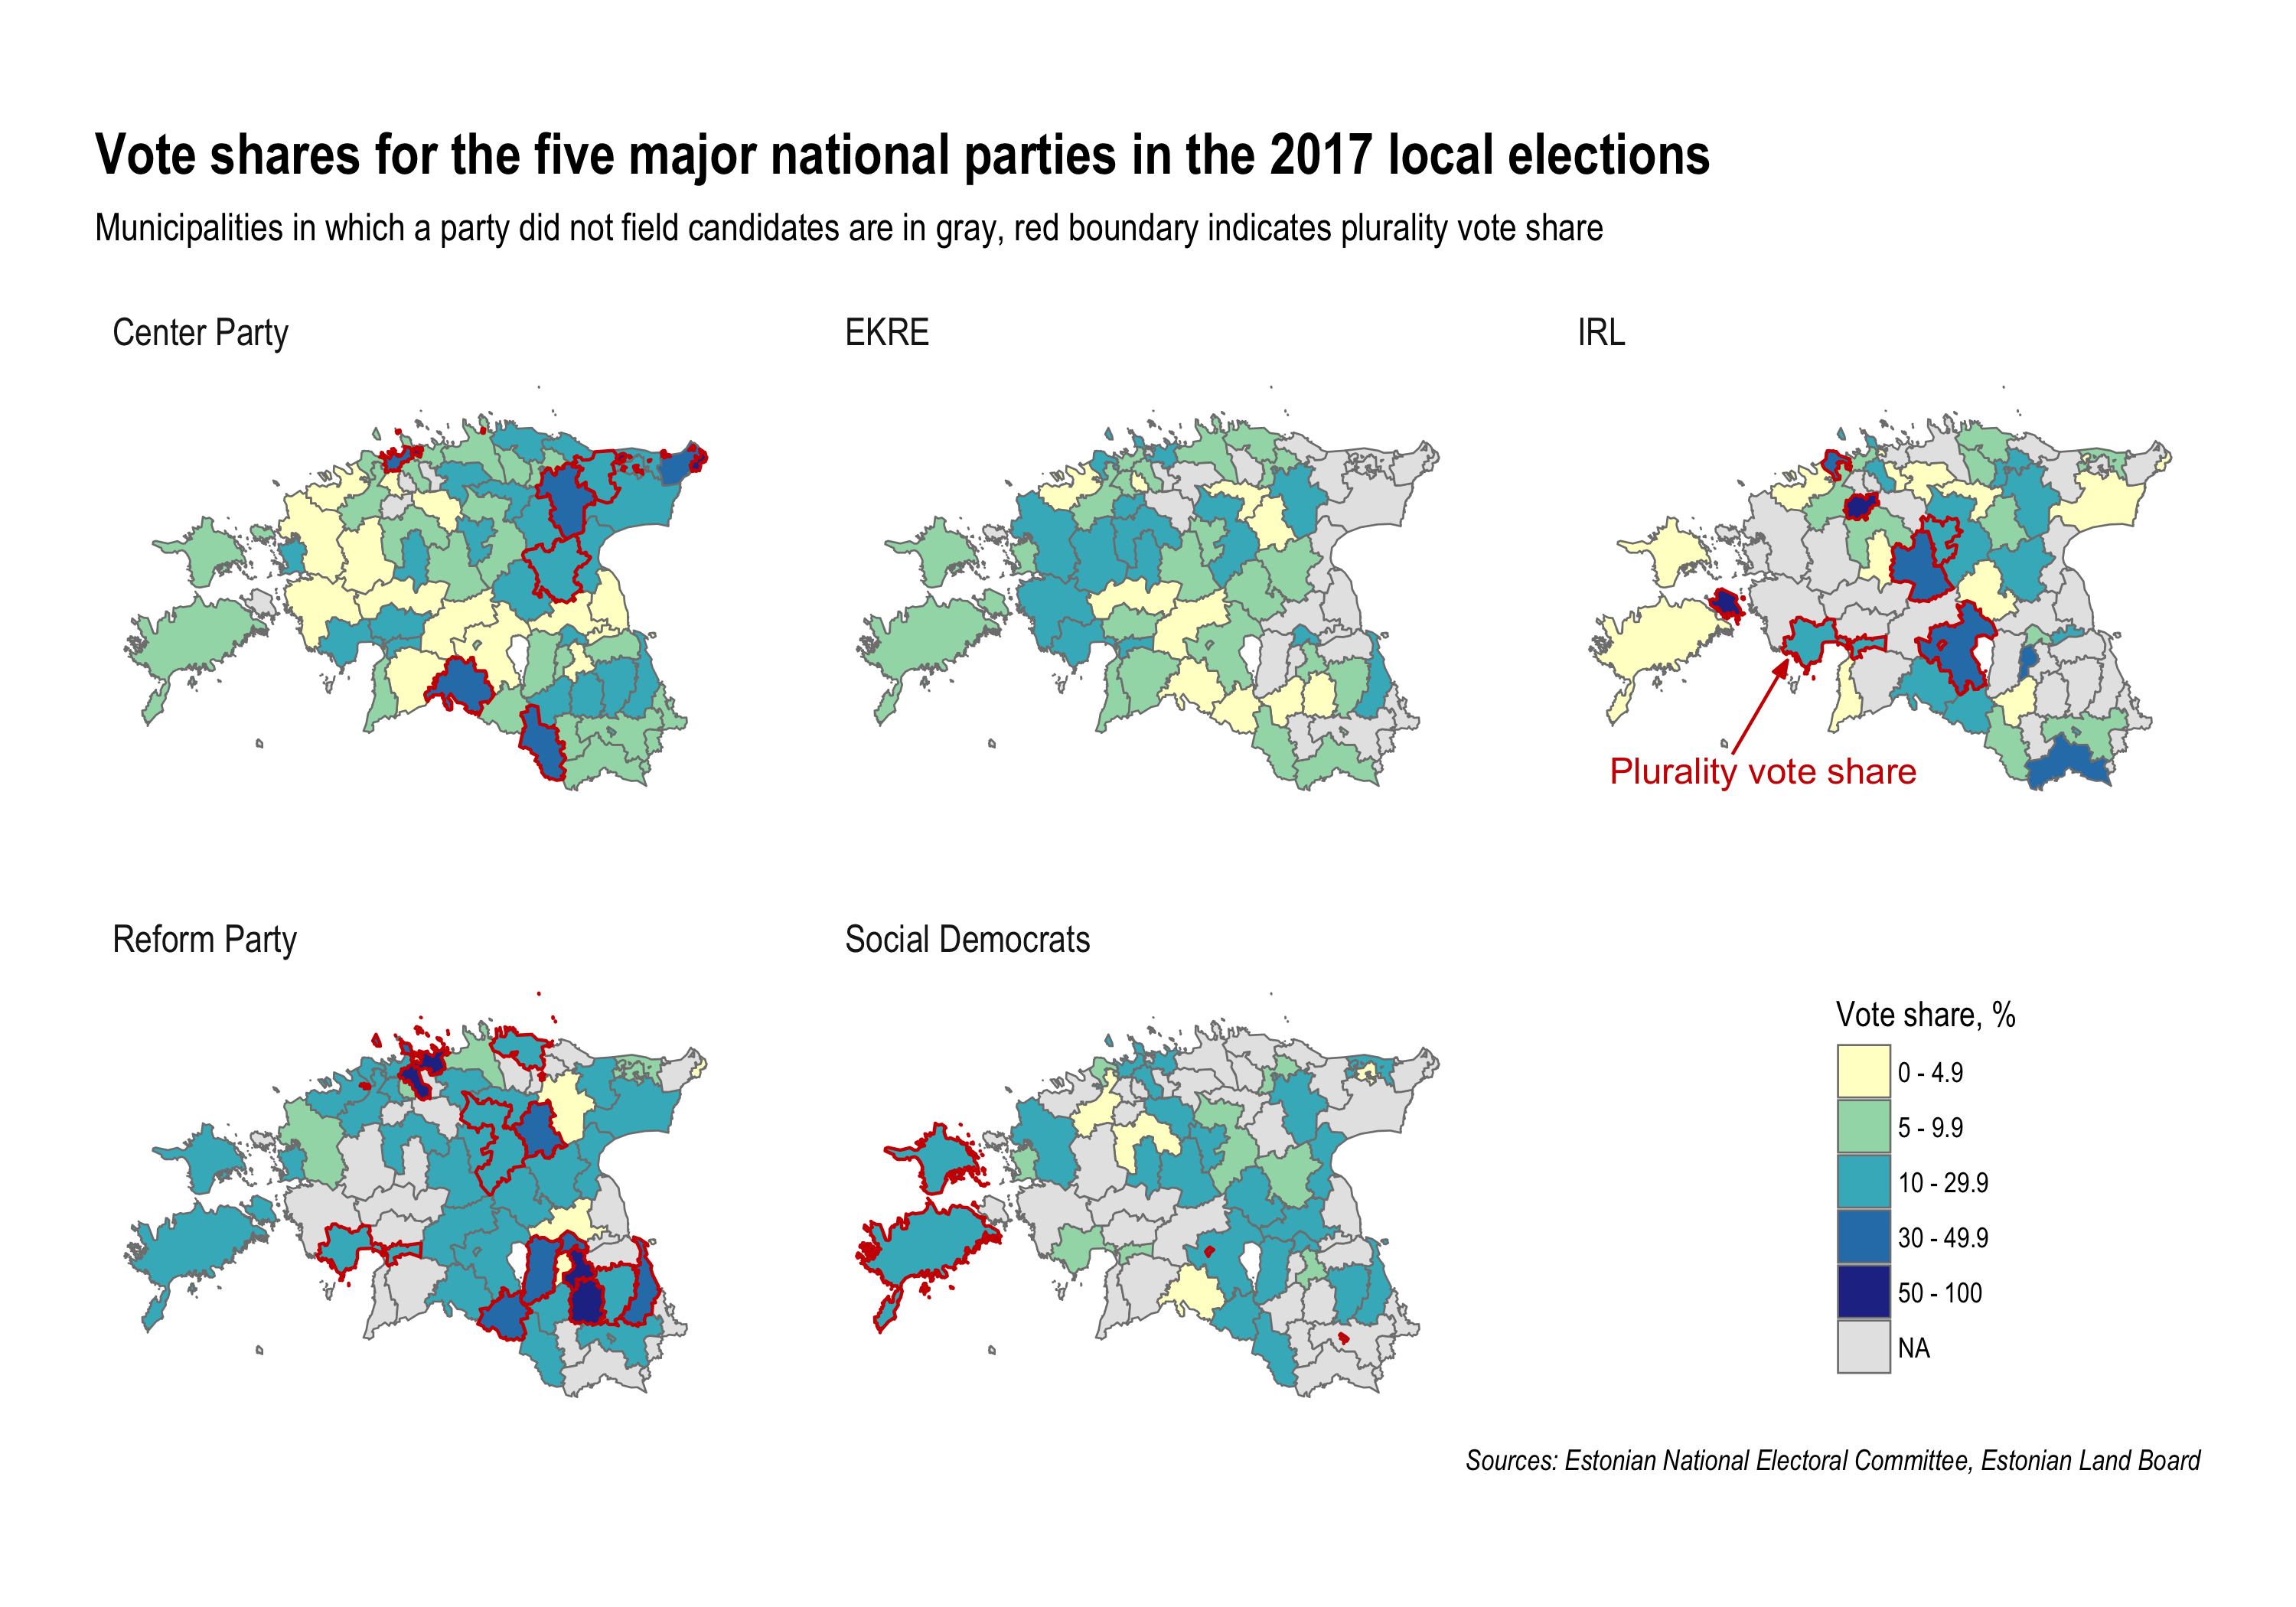
It’s not possible to say that this is a consequence of some action on part of the party, as much as it is a function of the distribution of Reform support across the municipalities, i.e. geographically. The reason the Center Party won less council seats and pluralities in proportion to its higher vote share is that their support is geographically more concentrated. Where the Center Party does well, it does really well. In one municipality it had a vote share above 80%. But the modal vote share is pretty low and close to the 5% threshold. So in many municipalities they failed to win seats at all.
The plot below shows the distribution of vote shares in each of the 79 municipalities for each party.
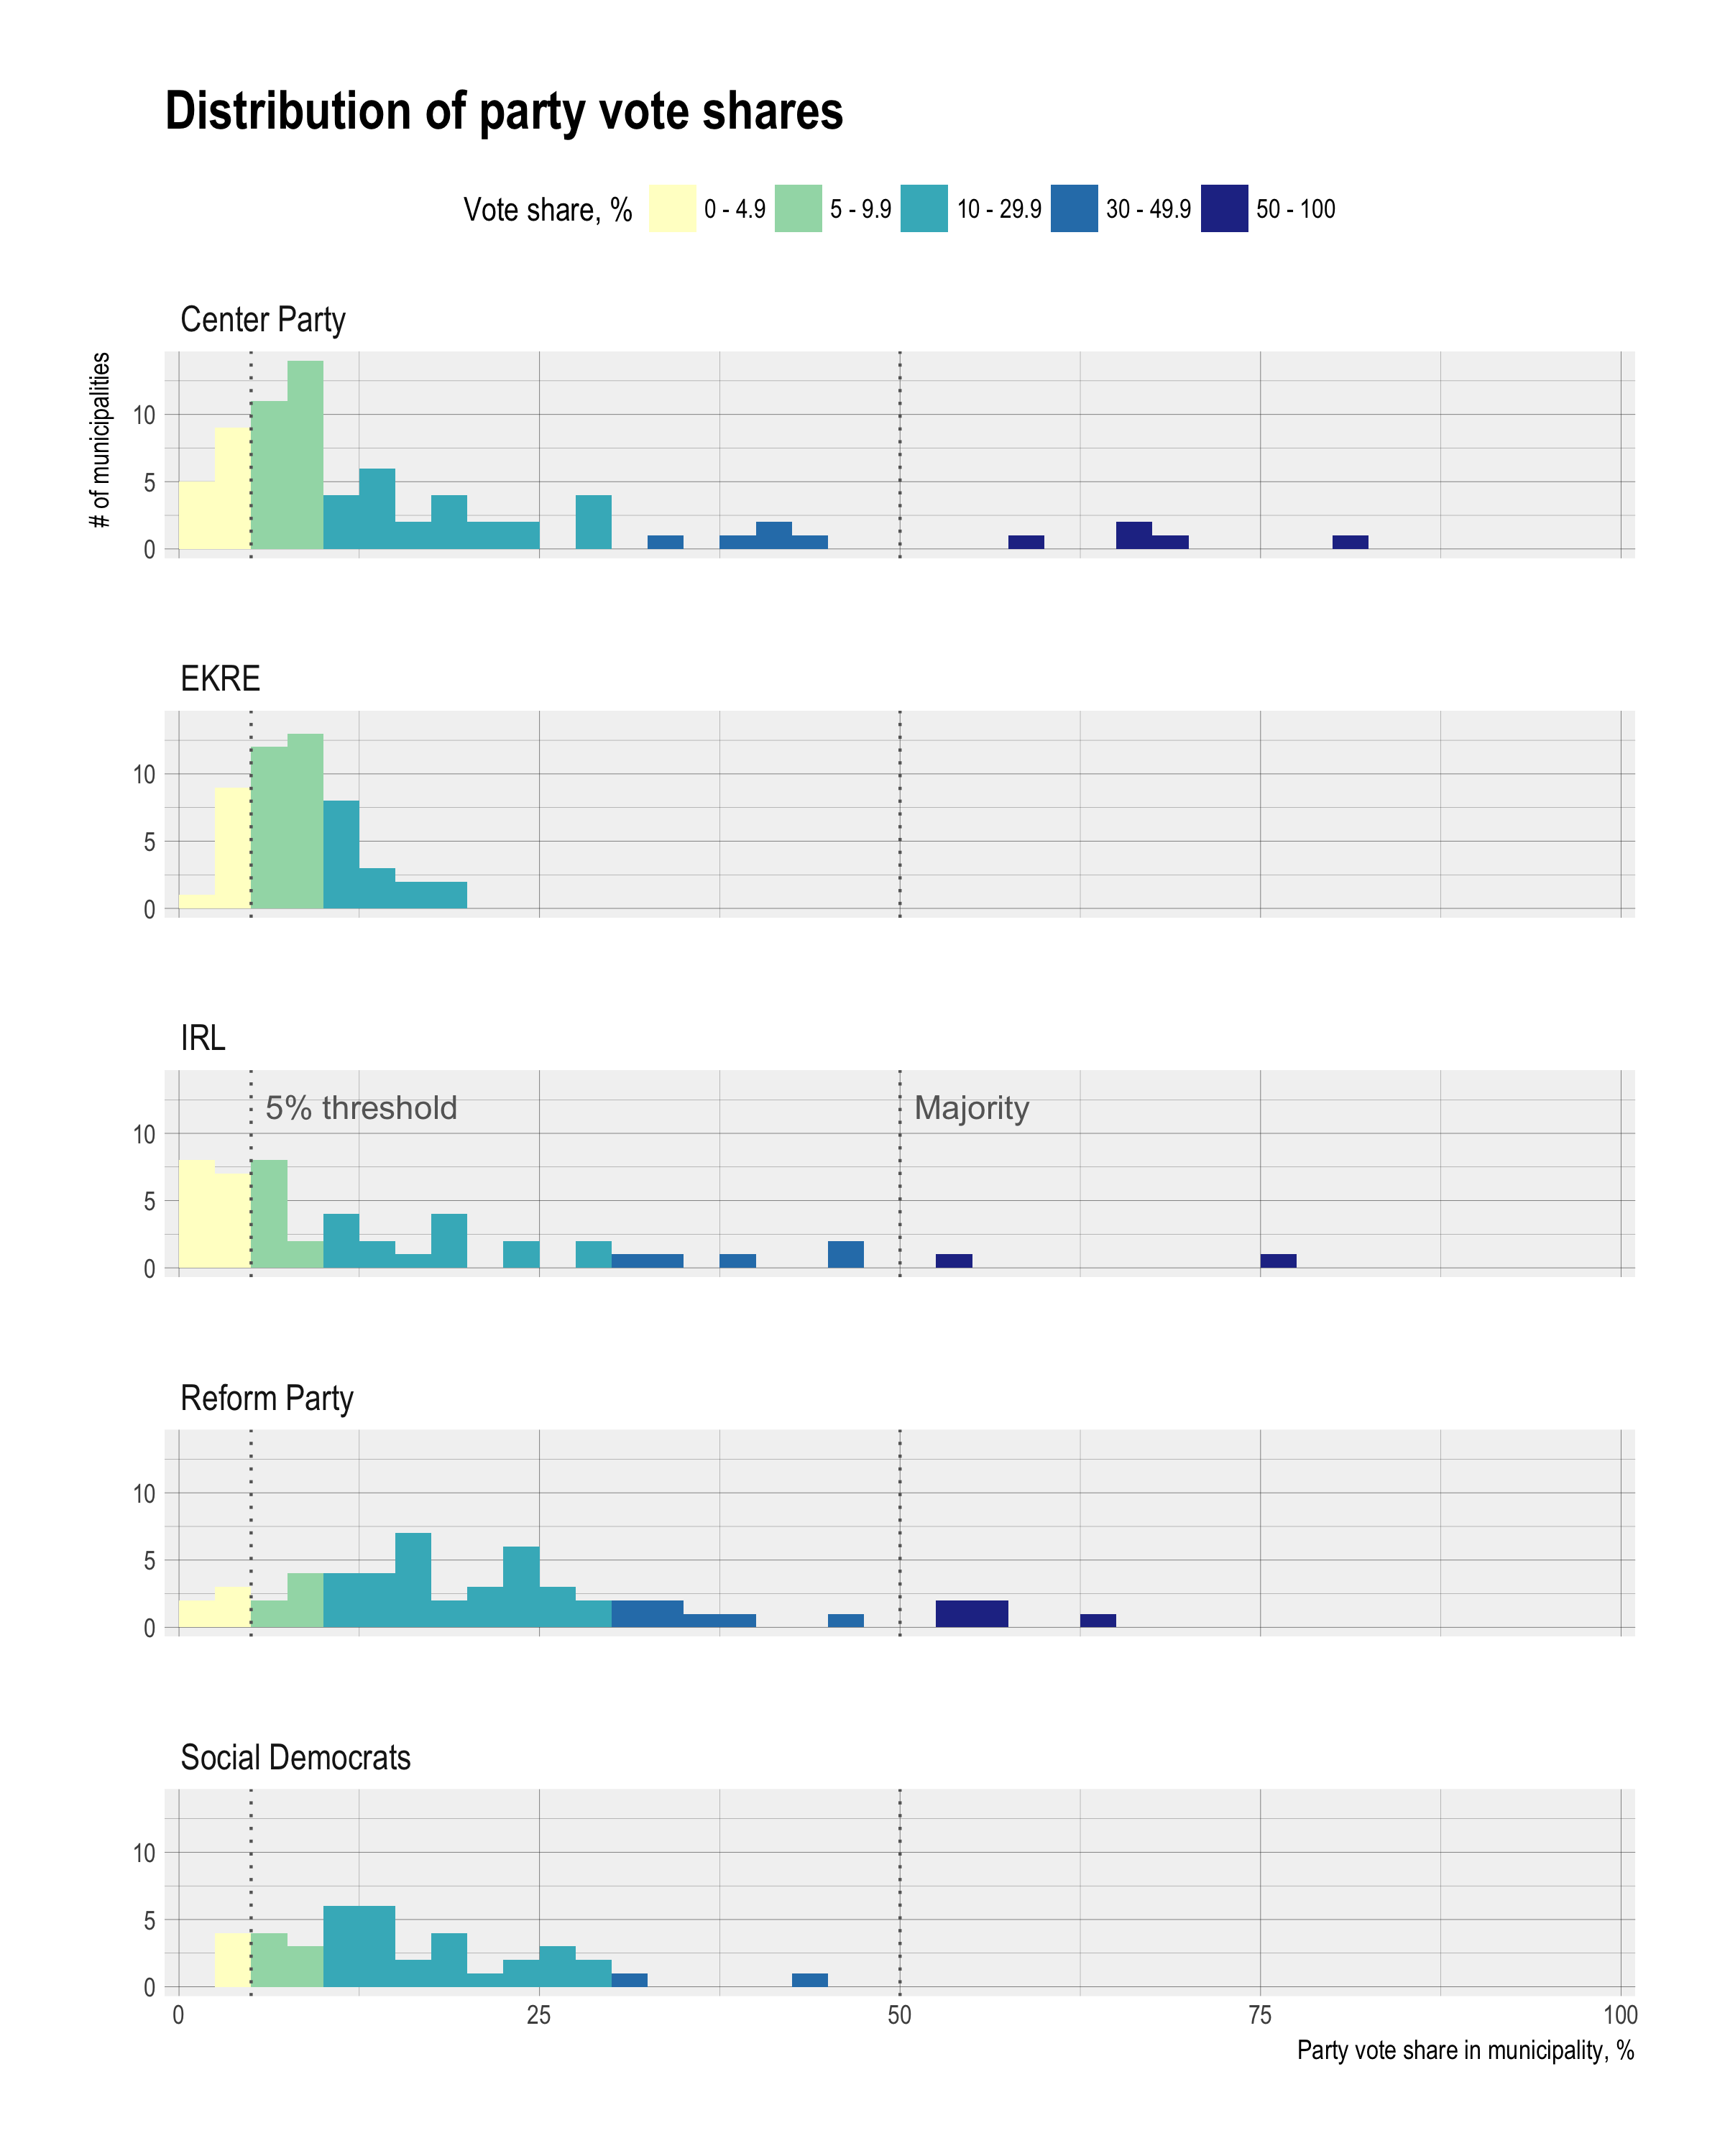
Both the Center Party and IRL have fairly low vote shares in most municipalities in which they ran, but much stronger results in a small number of outliers. The results for Reform and the Social Democrats, and EKRE for that matter, are more evenly and favorably distributed.
#3: People vs land, Center and Reform still have the most impact on people
The discussion and visualizations so far have emphasized municipalities and areas as units over population, and these factors are not well related at all. The population is distributed very lopsidedly, with a third in Tallinn alone. So whoever controls the Tallinn municipal government has almost by default the most influence at the local government level on people, and that would be Keskerakond, the Center Party. They also control the third largest city, Narva in the east, while Reform Party had pluralities Tartu and Pärnu, the second and fourth largest cities, respectively. Those four cities account for about half of Estonia’s population.
Maybe one way to think of this distinction is like this:
- if you ask a random Estonian who heads their local government, chances are it’ll be Center Party or Reform Party
- if you are driving through Estonia, or throwing darts on a map of the country, chances are that it’s an area with a local government headed by the Reform Party (well, a weird local electoral coalition most likely, but out of the major national parties anyways)
The population distribution is so skewed it’s hard to fit that onto a map at all. I tried below by plotting circles that represent the number of votes each party got in a municipality. The color scheme is the same, but points now mark the municipalities and they are scaled so that the area is proportional to the party’s vote in that area.
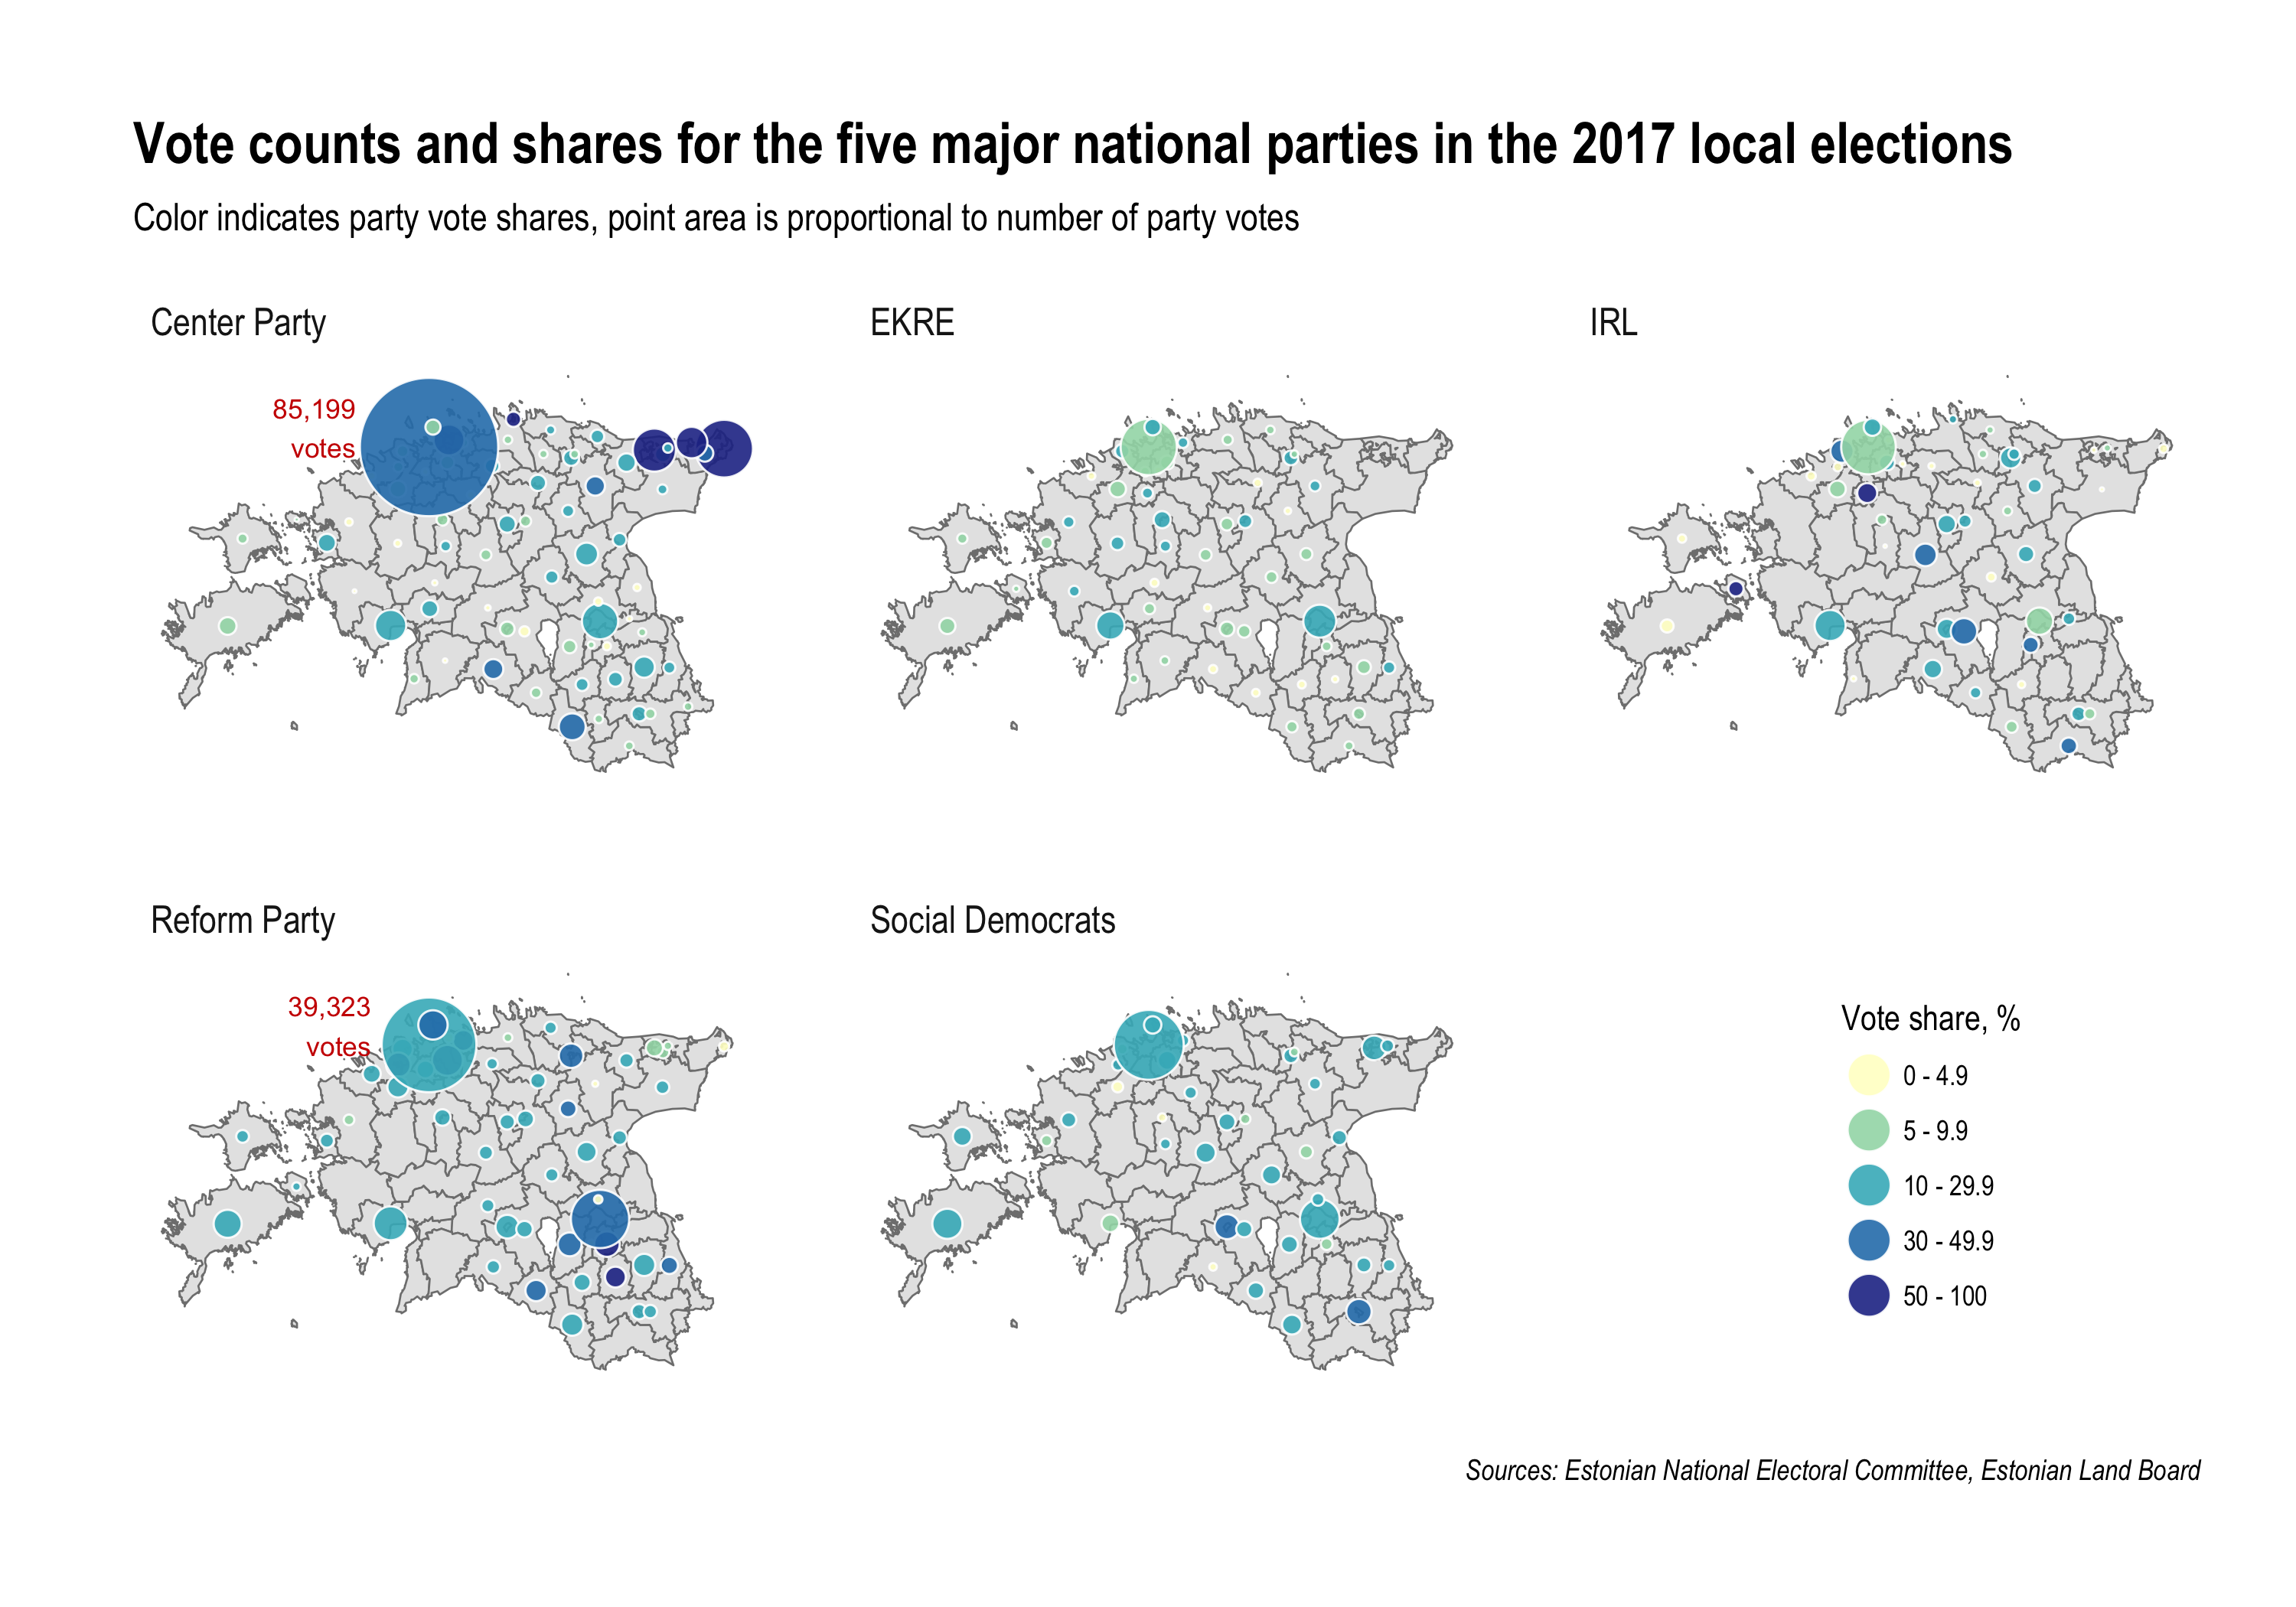
It’s just Tallinn. The city just dominates population. It’s 4.5 times as big as the second largest city Tartu.
One interesting thing that stands out when showing the results this way is how much the Center Party depends on support in Tallinn for its overall success. The table below summarizes the votes for each party and how much of it came from Tallinn.
| Party | Votes | Votes % | Tallinn | Tallinn % |
|---|---|---|---|---|
| Other parties/electoral alliances | 164356 | 28.2 | 20275 | 12.3 |
| Center Party | 158952 | 27.3 | 85199 | 53.6 |
| Reform Party | 113540 | 19.5 | 39323 | 34.6 |
| Social Democrats | 60299 | 10.4 | 21053 | 34.9 |
| IRL | 46394 | 8.0 | 12638 | 27.2 |
| EKRE | 39003 | 6.7 | 13437 | 34.5 |
More than half of the Center Party’s votes are from Tallinn, compared to about a third for the other parties. This probably is in large part because many of Estonia’s Russians, from whom the Center Party draws strong support, live in Tallinn. While around 40% of Tallinn’s population is ethnically Russian, the average for the rest of Estonia is more around 20% and even less if you also take out Eastern municipalities like Narva.
#4: There is a predictable deviation from pure proportionality: large parties have a slight advantage.
In a PR system the legislative seat distribution should more or less reflect party vote shares. In theory this works best when seat numbers are large since you can’t split a single council seat, but here we have 79 councils with a median of 21 seats. The first table already showed that the results are not proportional if we sum up to the national level—the Reform Party won almost as many local council seats as the Center Party with 7 percentage points less vote share. At the municipal level there is a very consistent relationship between party vote share and seat share. It is close to proportionality, but slightly in favor for larger parties.
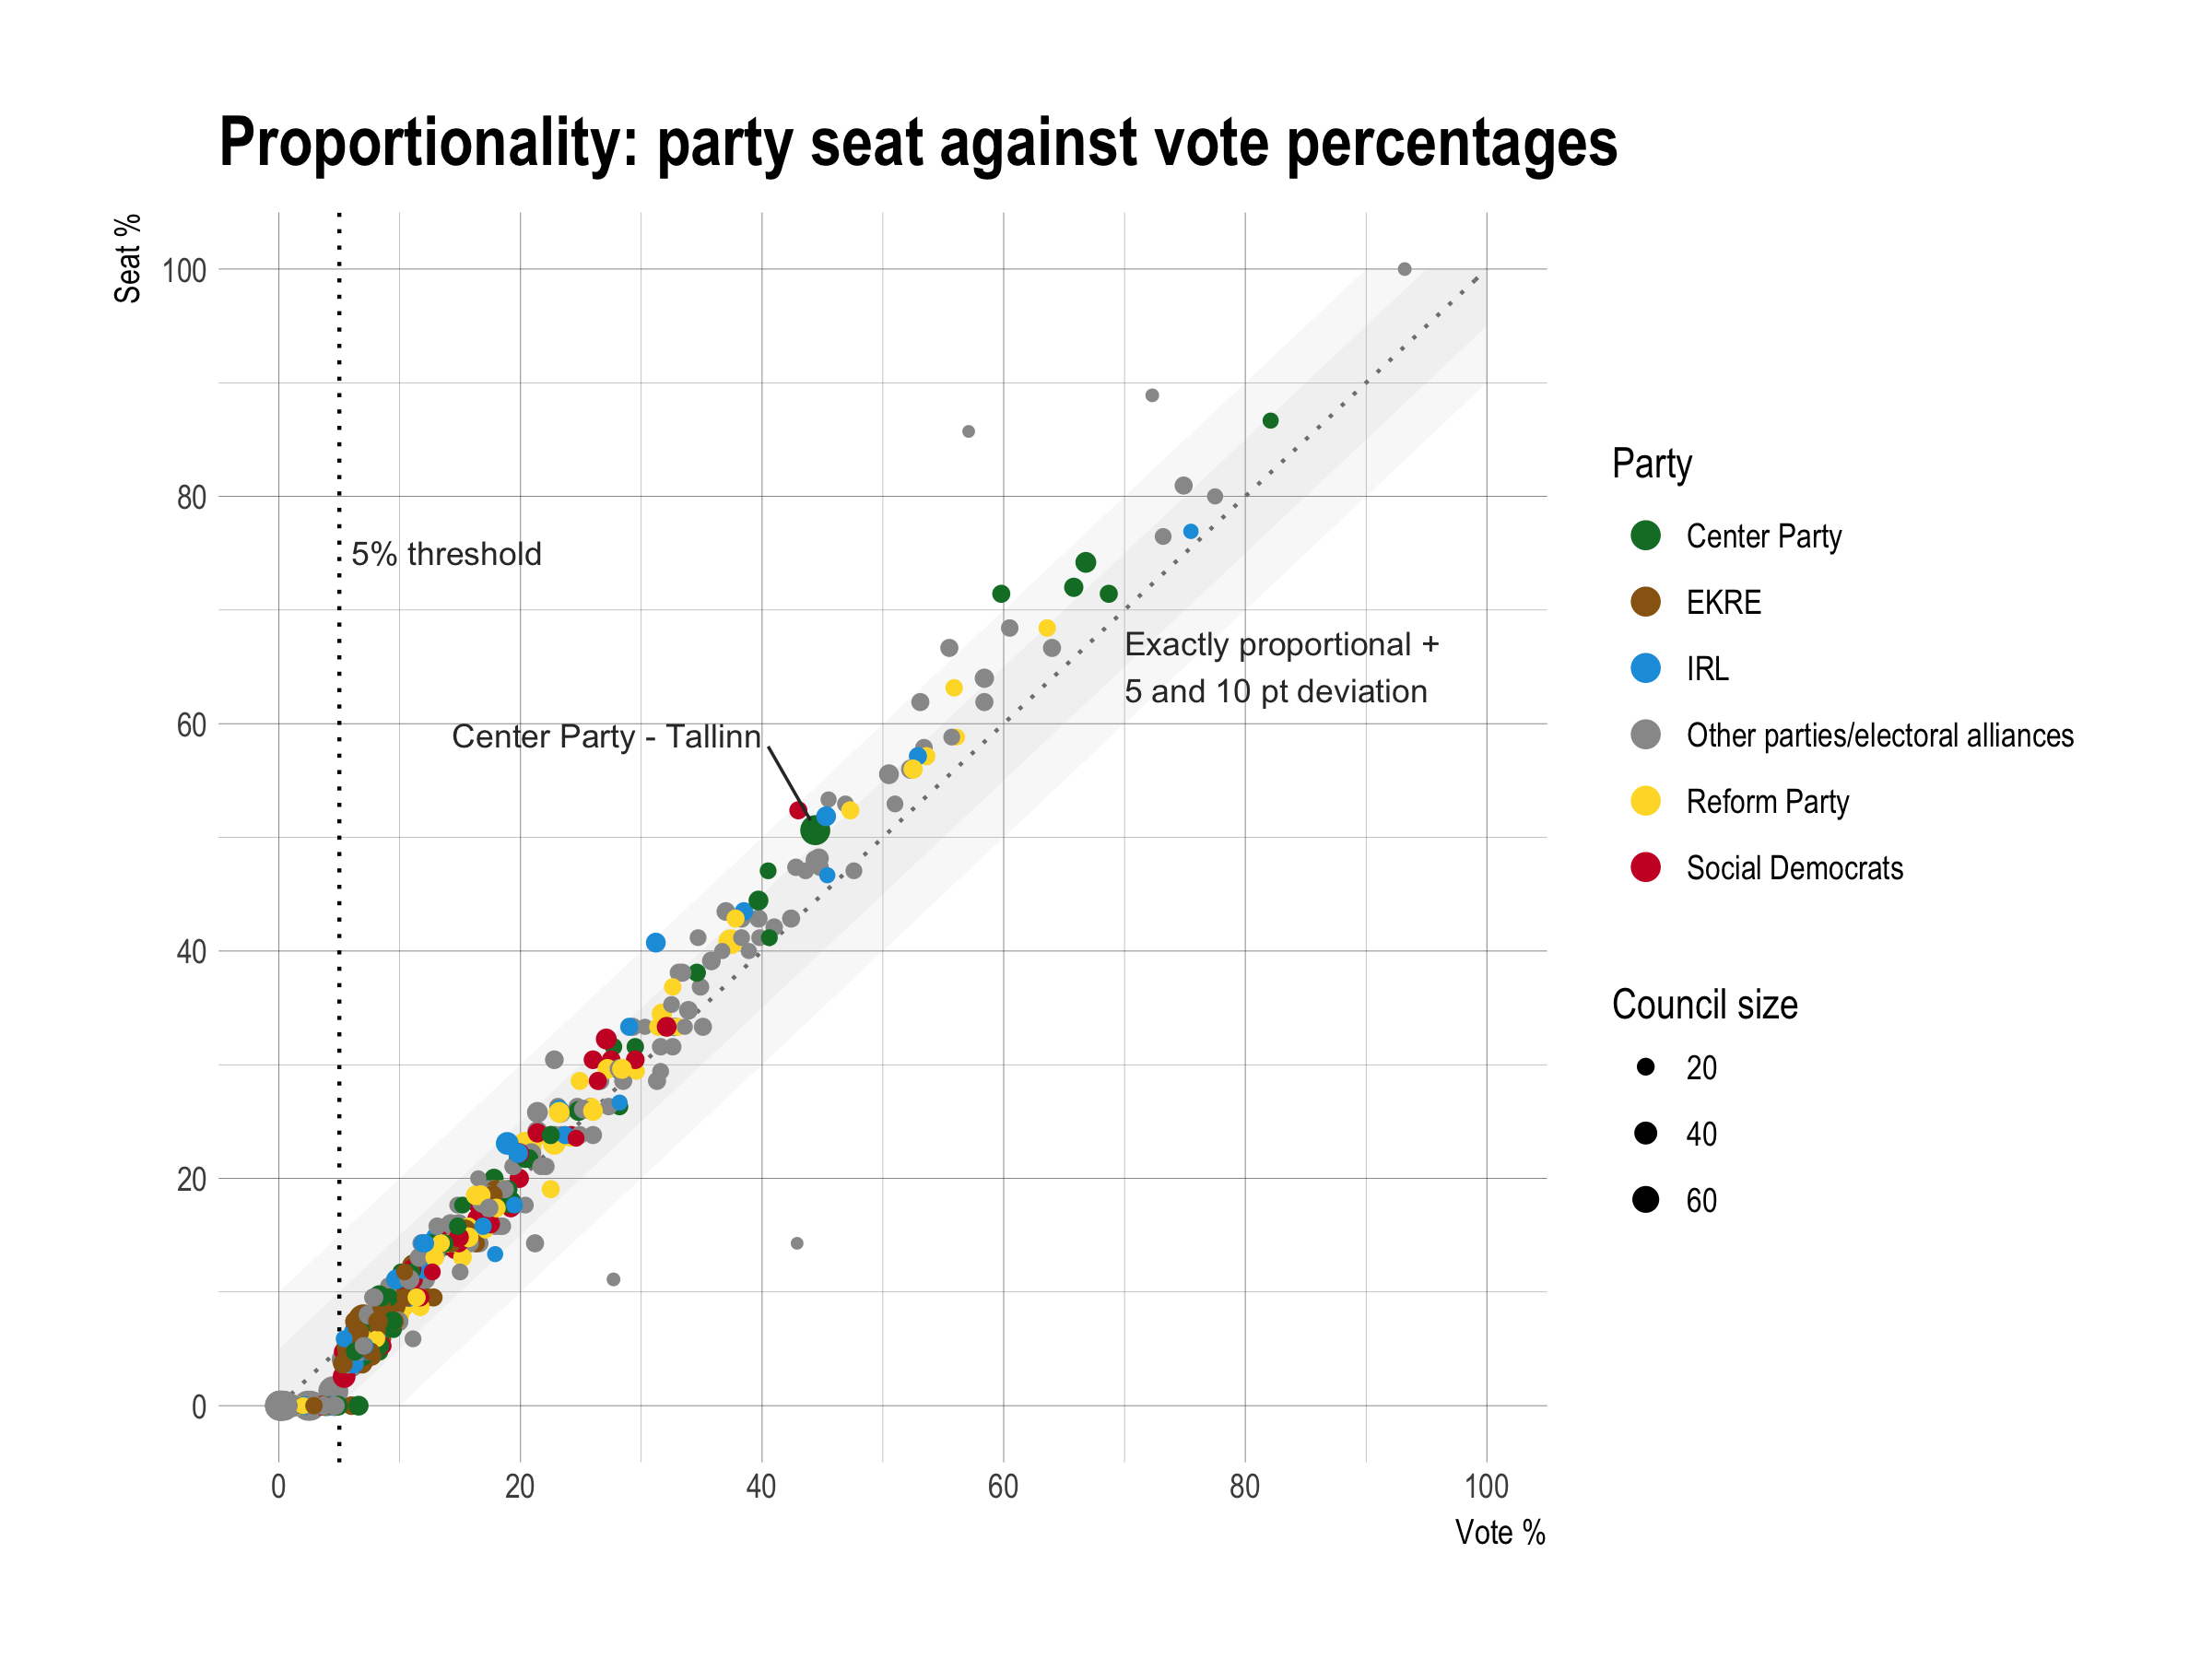
This shows party vote share on x against party seat share on the y-axis. The line and grey bands are exact proportionality—seat share matches vote share—and 5 and 10 point deviations from it. Each point represents a party’s vote share in a municipality. The size of the points is proportional to the local council size. Ninety-five percent of points are within 5% of exactly proportional results, but if you draw a line through those points it does not exactly match the proportional line.
This seems to be due to the specific method used to allocate seats to parties, the D’Hondt method. It slightly favors large parties. Specifically, for every percentage vote share above 15% a party on average received a 0.11% seat advantage. This is from a linear model of seat share on vote share (adj. R^2 = 0.98).
Generally, the spread in deviations from exact proportionality should be larger for small councils and smaller for larger councils. This does not work as expected. E.g. in Tallinn, which has the largest council size, the Center Party managed to win a 51% seat share with 44.4% of the vote. That’s an unexpectedly large deviation, and it was similar for the other large cities. The likely reason is that they are further sub-divided into electoral districts that each respectively have smaller district magnitude (how many seats they elect to the local council).
Regarding the 5% threshold, most parties below it had in fact 0 seats, but there were exceptions. This can happen when a candidate him or herself personally receives enough votes to be directly elected. Conversely, some parties above the 5% threshold did not get seats. In small councils the effective threshold to get seats can be higher. E.g. in a council with 7 seats you effectively need a list vote of around $100/7 \approx 14.3$ percent to have a chance at a seat.
How did the populists do?
What got me initially interested in the local election results was to see where EKRE did well. Like the goal was to just make a map of EKRE support across Estonia. That’s interesting in part because of the general fear about a surge in right-wing populist support since the election of Trump in the US in November 2016, and whether it would show in the elections in France, Germany, and other European countries this year. But I’m also a foreigner living in Estonia, so I’m curious how the local “we need to preserve the Estonian Nation” guys are doing. By the way, I took the colors in the plot above for each party from the Electoral Commission website, and they use brown for EKRE.
Fortunately their success and practical impact so far have been fairly low. They had the lowest total number of votes out of the major parties, at 6.7 percent. Below are maps for the vote and seat shares in the 79 municipalities.
While the vote share they received is higher than they had in the last parliamentary elections, it does not look like it translated to much actual influence at the local level. They did not do well in the East—no surprise given that that is where the Russian minority is. And in no local council were they able to obtain a plurality of seats.
The candidates
That’s mostly it for now. There were some things that I looked at which didn’t work out very well, I’ll mention them briefly here:
- Correlation between party vote shares. The pairwise correlations between party votes shares range from -.26 to .1. There are some stronger positive correlations, up to around .3, if one is willing to assume that a party’s vote share in a municipality in which it did not field candidates is 0. But overall still not clear cut “gotcha” relationships.
- An extension of this to a multivariate model (beta regression) that maps a party’s vote share to the vote shares of the other 4 major parties also did not work well. And in any case there is limited data (n=79 for this) to support that kind of modeling robustly.
- Support for communists. There is a quasi-communist party, competing at the national level (I think). It does not do well. There is one suburb east of Tallinn in which they managed to get a couple percent of the vote, but that is pretty much it.
In some future post I will look at the 11,802 candidates that ran for office, and whether there are any systematic pattern in who got elected. What I think might be interesting and also possible to do with the data are to look into how gender, education, and age played into the chances of being elected. And there are some interesting general descriptive statistics, e.g.: the Center Party and to a lesser extent EKRE were older, with 25% and 18% of candidates over 65 respectively compared to 10-14% for the other parties. EKRE’s candidates also tended to be male (72%) and slightly less well-educated than average. The Social Democrats had the best gender balance at 49% women candidates.
Thanks to the Electoral Commission for providing data on the results in machine-readable format.
-
There have been several rounds of administrative reform in Estonia actually in which county and municipal borders have been redrawn. I gather that the latest round was to aggregate municipalities with a population less than 5,000. I wonder what the process for changing county borders in the US is, if there is one (and I think there isn’t for state borders). ↩︎
-
The simple quota, equal to (# of total votes cast) / (# of seats in council). ↩︎