Archigos leader turnovers by regime
Tags:
#Archigos
#Coups
#Irregular Leadership Changes
#Polity IV
This post is about the Archigos data, which you can find here.
Political scientists, and maybe historians as well, are familiar with coups, rebellions, and mass protests as distinct phenomena that lead to the fall of regimes occasionally. Another way to view these events is from the perspective of state leaders, and how these events affect transitions between political leaders. Selectorate theory does this by considering the sets of people within a regime that a leader must rely on to remain in power, and how their relative sizes shape behavior. We do this empirically by modeling irregular leadership changes, where we draw our dependent variable from the Archigos dataset. I’ve been vaguely aware of these data for a while, but honestly did not understand well how useful they could be. In this post I’ll try to give a quick overview of the data.
Archigos is a dataset of the political leaders of states from 1875 on collected by Hein Goemans, Kristian Skrede Gleditsch, and Giacomo Chiozza. The most recent version, 2.9, has more than 3,000 leaders through 2004 and an update to 2014 is in the works. Aside from identifying leaders and when they gained and lost office, it codes how they did so (from the Archigos codebook):
Archigos codes the manner in which transfers between rulers occur. Our main interest is whether transfers of power between leaders take place in a regular or irregular fashion. We code transfers as regular or irregular depending on the political institutions and selection mechanisms in place. We identify whether leaders are selected into and leave political office in a manner prescribed by either explicit rules or established conventions. In a democracy, a leader may come to power through direct election or establishing a sufficient coalition of representatives in the legislature. Although leaders may not be elected or selected in particularly competitive processes, many autocracies have similar implicit or explicit rules for transfers of executive power. Leader changes that occur through designation by an outgoing leader, hereditary succession in a monarchy, and appointment by the central committee of a ruling party would all be considered regular transfers of power from one leader to another in an autocratic regime.
So whether a leadership transition (entry or exit) is regular or irregular depends on the regime in which it takes place. A father-son transition is regular in hereditary monarchies like Saudi Arabia, but wouldn’t be in a democracy (without intervening elections). Although it is a bit subjective, this is actually a really powerful concept that seems to encompass successful coups, mass protests campaigns, and rebellions (i.e. civil wars where the goal is overthrow of the central government). We show this to some extent in one of the appendices to a long report we wrote in the summer, where we found that almost all coups, using the Powell & Thyne data, overlap with irregular entries in the Archigos data.
When we think about the ways in which irregular transitions can occur–often coups, weak autocracies with politicized militaries come to mind. So I thought it would be interesting to look at the regularity of transitions by regime type. To measure regime types I used the Polity IV dataset, which along with Freedom House, is a common measure of regime types used in IR (despite what comparative political scientists who research this, among other things, might think). Polity measures a several aspects of a regime, and uses these to construct 0-10 composite indicators for the autocratic and democratic tendencies of the regime, which are in turn commonly subtracted for a combined Polity score ranging from -10 (autocracy) to 10 (democracy). The website bins these scores into a a couple of categories, like democracy and anocracy, that I use here.
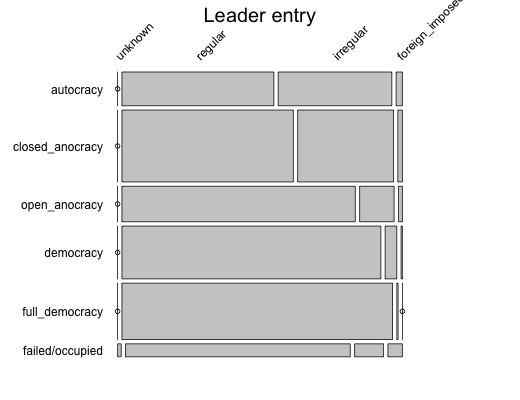
First, here is a mosaic plot of how leaders entered office by regime type. The area of the cells in these plots corresponds to how many cases fit that combination. Most regimes historically have been “closed anocracies” or what we might call weak autocracies. But even in these and full “autocracies”, most leaders entered office regularly, in keeping with that regimes conventions (aka selection by the Politburo). Unsurprisingly, the vast majority of leaders in democracies entered office regularly.
The second plots shows how leaders left office, by regime type. There are a few more possibilities here, like suicide. Quite a few leaders in autocracies are in power until their death (Stalin, Kim Il Sung come to mind).

Although irregular assumption of and exit from power are far more common in authoritarian regimes, regular transitions are still the most common means, with the exception of full autocracies, where leaders are much more likely to die in office (e.g. Hafez al-Assad in Syria, Deng Xiaoping in China) or be overthrown (e.g. Mobutu Sese Seko in the DRC, Siad Barre in Somalia).
Another interesting part of Archigos to look at is how long leaders were in power. The plots below are histograms showing the frequency of tenure lengths in months by the different Polity regime types (note the x-axis is logged):
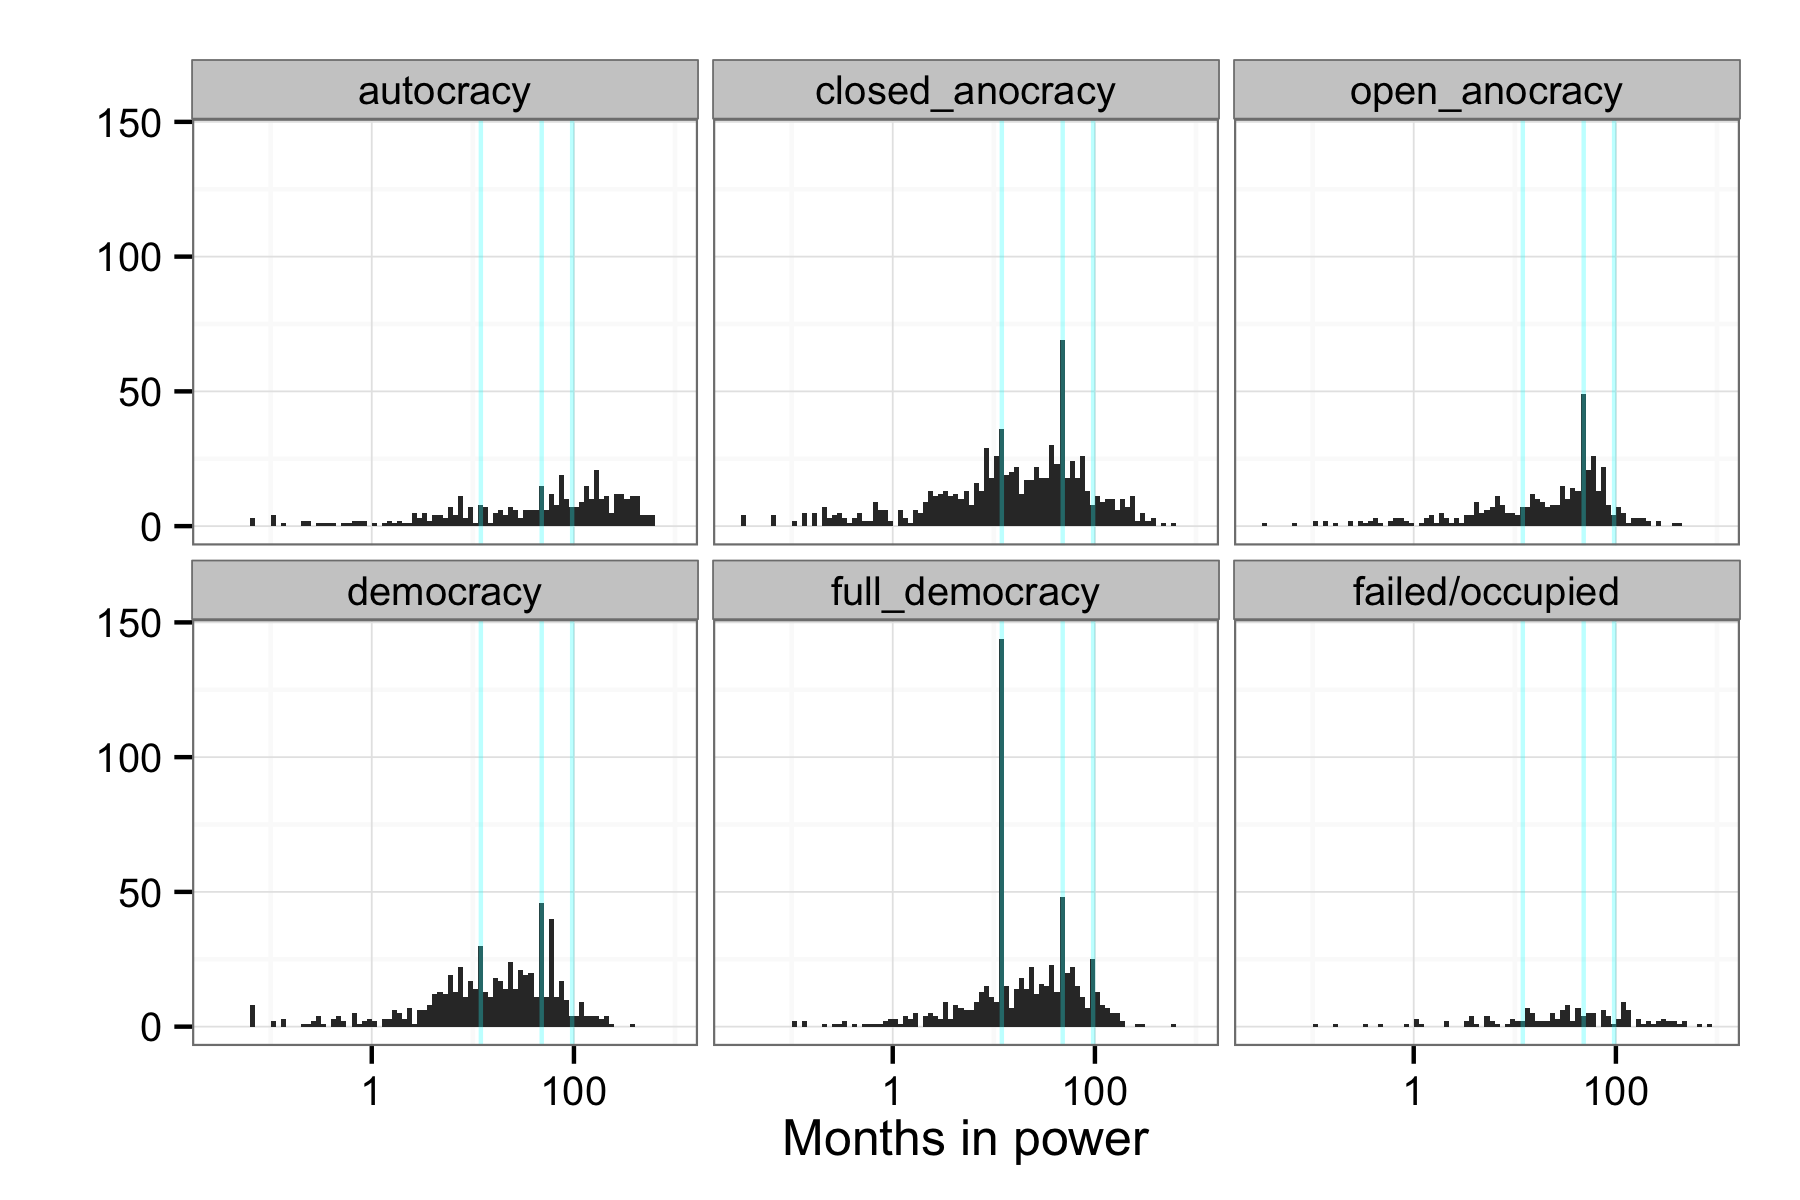
Three patterns, not entirely unsurprising, stand out in these histograms:
- Notable spikes at 1, 4, 8 years, and to some extent also at 5 years. The one year spike in democracies is largely driven by Switzerland, where a President is elected for one-year terms from the seven-member executive council. The others correspond to the common election cycles (4, 5) and term limits (8).
- The spikes are present even in less than full democracies, what Polity calls open and closed anocracies, showing that elections work here sometimes, at least.
- Leaders in autocracies last longer than those in democracies, but also than those in partial autocracies. It’s a bit hard to tell with the logged axes, but there are quite a few leaders in autocracies who were in power for a really long time–these are your old-school monarchs like Francis Joseph I of Austria-Hungary (27 years) and
For the last point, that a few autocratic leaders hold on to power for really long times, that doesn’t really seem to be changing. The plot below maps the time in power for leaders who have completed their time in office: the mean, shown by the gray band for the smoothed mean, doesn’t seem be changing over time. (Since there are fewer autocracies nowadays than historically, I wonder if that means that the remaining autocracies are very consolidated ones with long leader tenures.)
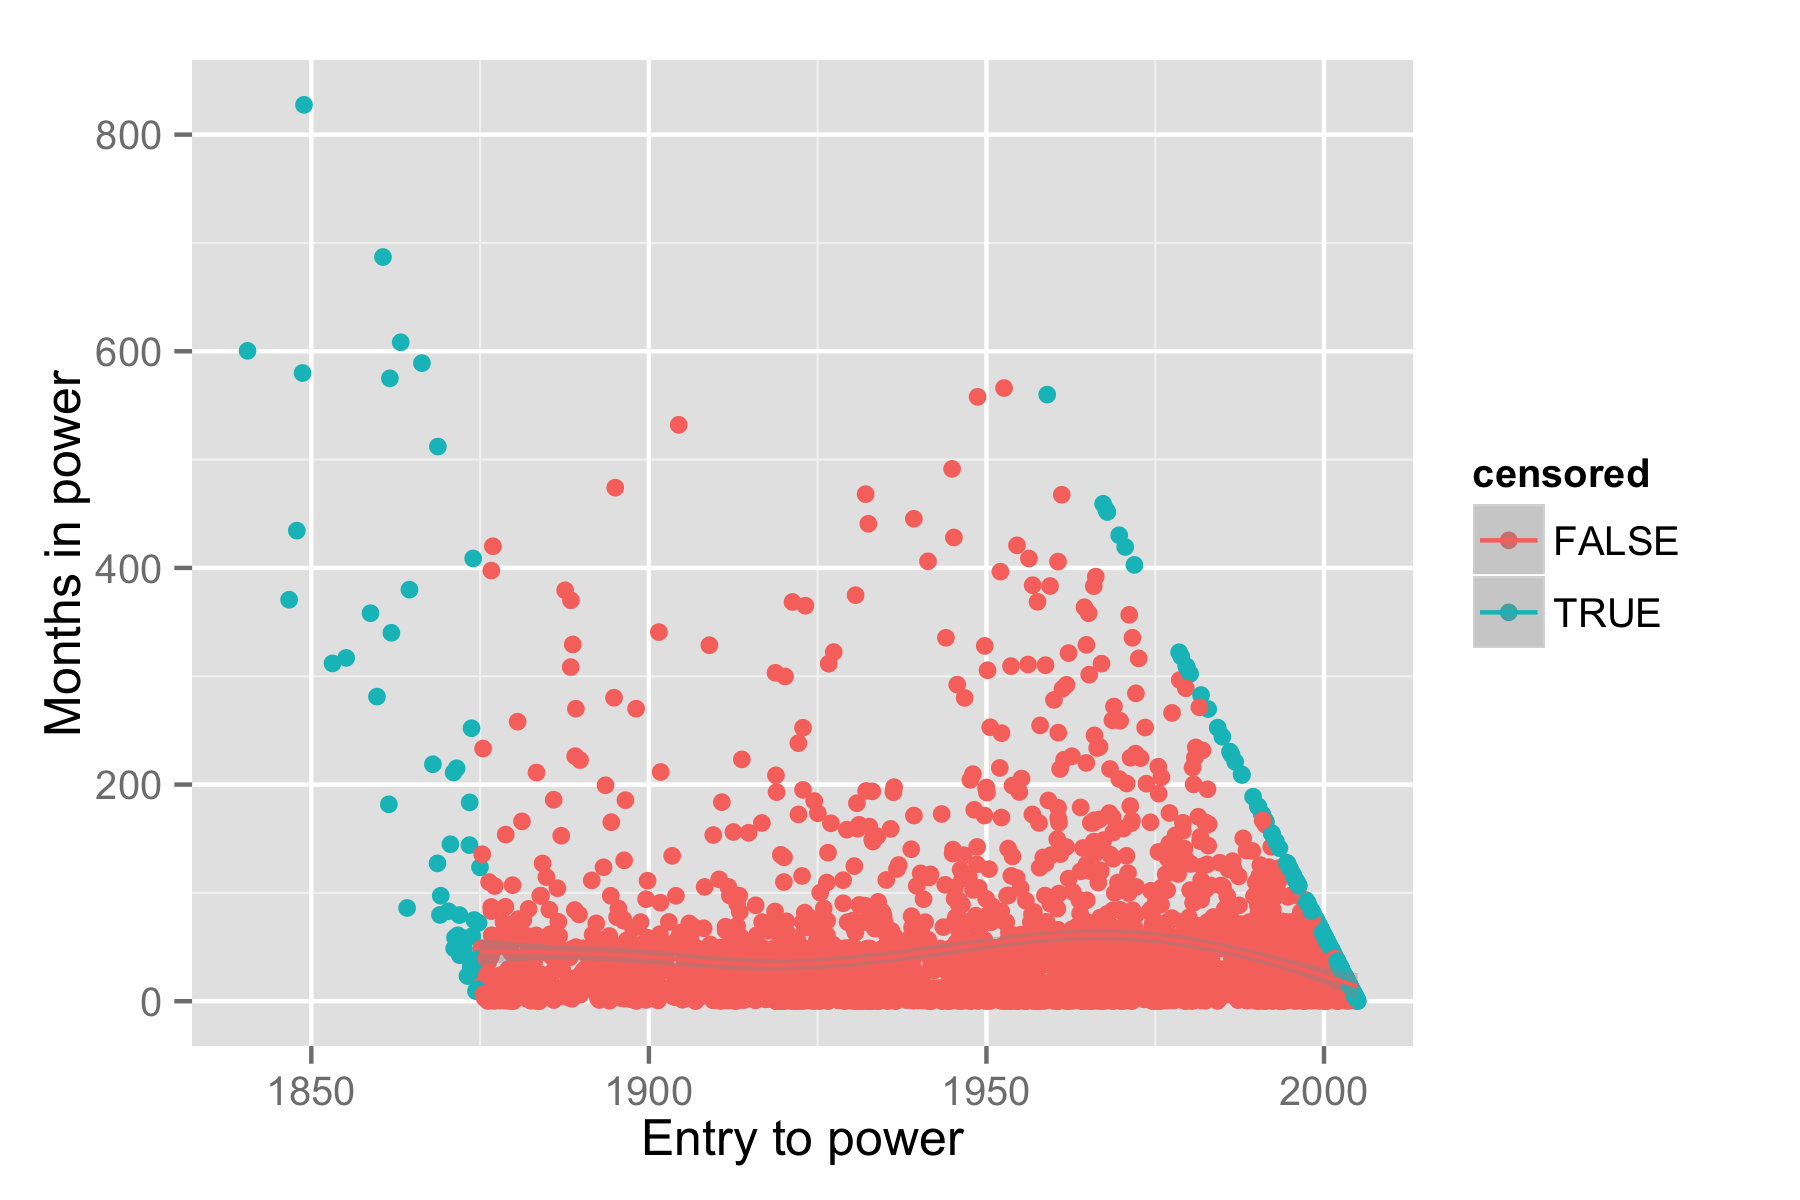
Leaders who entered power are are still currently in power are highlighted in cyan. The mean does not seem to change much over time.
That’s it for Archigos. About the larger point, a lot of published (quantitative) political science consists of explanatory modeling, focused on theory-building and hypothesis testing as it is. The work I do mostly falls into a second category, prediction, which is not, but maybe becoming more, widespread. Basic description like this partly occurs as part of the other two, but often falls to the wayside in online appendixes and supplementary materials. But it seems to me that this is an area in which political science stands in contrast to a lot of popular misconceptions about political conflict (and maybe other aspects of politics as well), like for example how widespread torture is, or how (un)common civil wars and terrorism are. And unlike statistical modeling, formal theory, etc. it’s relatively easy for non-technical people to follow (I think).
Lastly, some technical details. Here is the code to replicate the figures. It basically merges the Polity score to the Archigos record for each leader. Since Polity scores can and do change over the course of a leaders tenure, it uses the mean Polity score, weighted by the length of time that those Polity scores overlap a leader’s tenure.