Modeling and predicting IEDs
Tags:
#Afghanistan
#Counter-IED
#IED
This first appeared on Predictive Heuristics, my employer’s blog.
Improvised explosive devices, or IEDs, were extensively used during the US wars in Iraq and Afghanistan, causing half of all US and coalition casualties despite increasingly sophisticated countermeasures. Although both of these wars have come to a close, it is unlikely that the threat of IEDs will disappear. If anything, their success implies that US and European forces are more likely to face them in similar future conflicts. As a result there is value in understanding the process by which they are employed, and being able to predict where and when they will be used. This is a goal we have been working on for some time now as part of a project funded by the Office of Naval Research, using SIGACT event data on IEDs and other forms of violence in Afghanistan.
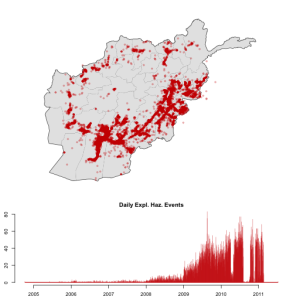
Explosive hazards, which include IEDs, for our SIGACT data.
The use of IEDs itself is not new at all. Mines, booby traps, or other similar improvised devices have been used for hundreds of years. Examples abound. Lawrence of Arabia, in Seven Pillars of Wisdom, discusses their use against the Ottomans in Arabia during World War 1 to some length, and more recent conflicts in which they figure prominently include the Vietnam War and the Northern Ireland Troubles.
What has changed in the past 10 or 20 years is not the fact that they are used, but the importance they have taken on, both in the volume of use and their effectiveness in causing casualties. The incentive structures underlying this trend have, arguably, made them a weapon of choice in asymetric conflicts where emerging, low-tech forces face advanced professional militaries. Western democracies are casualty averse, leading to armies that are increasingly well protected with equipment like mine-resistant vehicles and Iron Dome-like defenses (video) against mortar and rocket fire, and which can respond to the enemy with obscene amounts of firepower and surveillance capability, e.g. drones and 500lbs bombs against people burying IEDs.
In the cost part of the equation, the internet has made it easier to disseminate the know-how for making explosives and building various devices, and the broad range of modern electronics makes it possible to remotely trigger bombs without exposing oneself to direct retaliation.
In sum, IEDs are not going away. If professional militaries continue to become better protected and armed, and IEDs with complex remote triggers easier to make, they will if anything become more prevalent.
In our effort to model and predict IEDs in Afghanistan, we have tried to push resolution to the most-detailed level possible, and far below the common country-year unit, in order to be able to predict at a level that is operationally relevant. The limits on how low we could go were set by the data available to us, and along the way have created unexpected challenges that forced us to adapt to modeling on the cusp of somewhat big data.
Our data on IEDs come from a declassified set of SIGACTs–significant activities reports–for 2009 and parts of 2010 in Afghanistan, shown in the figure above. These are short reports on engagements with the enemy and other kinds of events that were/are routinely collected by US forces in both Afghanistan and Iraq in the course of tactical operations, and which heavily inform the picture higher levels have of the larger conflict. In the world of political science and conflict research, the SIGACTs are essentially event data, albeit not collected on the basis of media/news reports, as most other efforts are (e.g. ACLED, UCDP GED, SCAD). Larger subsets of the SIGACT database are the basis for the WikiLeaks war logs as well, which most people are probably more familiar with. Unlike those, our data are officially sanctioned, but similar to WikiLeaks they are degraded and censored to obscure some information.
Temporally, our SIGACT and thus IED data are resolved to the day. The locations are more accurate but given the resolution of other spatial variables that we considered as potential covariates we decided to use 1 by 1 kilometer squares as our spatial unit. Our unit of observation thus is a 1km2 cell-day.
This is smaller than typical compared to work in the “disaggregating civil war” vein, but not unprecedented. For example, in a project on reciprocity of violence in Iraq, Linke et al (gated) use 1km2 cells with 3-day windows for Baghdad, and 10km2 cells for the rest of the country. But it is small enough that modeling all of Afghanistan is a bit too high of a goal. To make the problem more tractable we decided to instead focus on smaller areas of the country that appeared to contain sufficient numbers of IED events. For convenience we settled on 100 by 100 km grids, which gives us 10,000 cells per day.
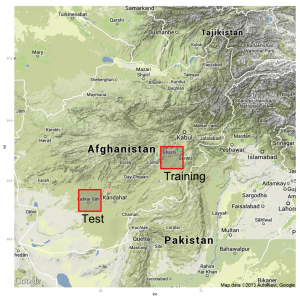
Location of the two grids near Ghazni and Lashkar Gah.
As our interest is in prediction, we need a way to evaluate how well our model predicts out of sample. Model fit in sample, with the data used to estimate the model parameters, is usually an optimistic indication of out of sample fit due to overfitting. To that end we use data from two areas, shown in the map above, and split into two time periods. The first area in the east is near the city of Ghazni and we use the first 10 months in 2009 for training data that is used to estimate the models. Data from the next five months, into the end of Q1 2010, for both areas is used for two test sets. This allows us to test how well our models, estimated with data from Ghazni, predict future IEDs in Ghazni, but also how well they generalize across space with the Lashkar Gah test set.
We chose the two grids on the basis of superficial similarity: both are centered and mid-sized cities on the ring road, and both experienced fairly high levels of IED activity. The distribution of IEDs in both areas is shown in the figure below, with separate maps for the training and test time periods. It’s immediately apparent that the southern area near Lashkar Gah had an overall higher level of violence, and that events were more concentrated geographically to the irrigated areas south of Lashkar Gah (which interestingly were irrigated with help from the US in the 1950’s). There is also a marked uptick in early 2010 that corresponds to the US offensive around Marja–Operation Moshtarak.
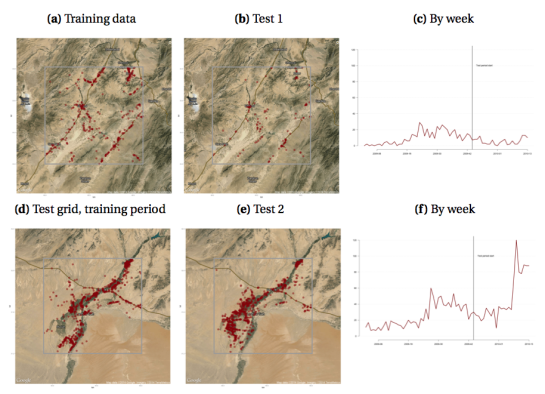
Observed IED counts and frequency by week for the two grids over the training and test time periods.
Our modeling problem is in a general sense a question of binary classification: we want to predict whether a cell has an IED on a given day or not, i.e. just a 0 or 1 prediction. Like similar problems in international relations, the events in our data are rare, although much rarer than the usual rare events data. Our setup, with ~1km2 cells observed over 304 days in the training period, gives us 3.04 million data points for the training data that among them contain 432 positive events. So even though visually there appear to be a large number of events, our resolution leads us to sparse data in the end. In the two test sets we have 1.51 million data points each with 117 and 988 IED events respectively. The base rates, or the naïve probability that any cell-day had an IED, across our data sets are 1.4, 0.8, and 6.4 in 10,000. Those are percents of a percent, and obviously very low.
One of the strategies we have relied on for dealing with rare data is to use split-population duration models. Like regular duration models a la Weibull, they allow us to account for temporal dependence, but they are also sensitive to the fact that most areas like a mountain top or the middle of the desert far away from a road will never experience an IED. They do so by simultaneously estimating the chances that a cell-day is in the risk set of observations that will experience an IED at some point in the future and the probability that those at risk will have an IED event now, not later. One of the advantages in estimating what cell-days are at risk for an IED rather than dropping mountain tops from our data is that it allows us to identify border cases where the lack of risk is less obvious. By identifying subsets not at risk it allows us to deal with excess 0’s in our data in a way similar to zero-inflated models.
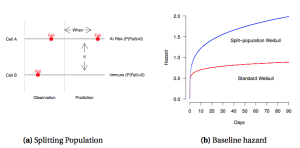
Split-population duration intuition: first, the model separates cases that are likely to experience an event in the future at all, and second it estimates the likely time until such an event for cases at risk of any event.
Our initial models, so far largely based on temporally-invariant spatial variables, reach AUCs of 0.85 to 0.90, which is decent in an absolute sense, but that with the sparsity in our data leads to too low precision for any reasonable level of recall. Precision, for those not familiar, is essentially a measure of how confident we can be in our model’s predictions, i.e. the predicted positives will really be IED events, and recall indicates what fraction of IED events are captured by our model, i.e. how broad it is. One the bright side, it looks like the results easily generalize to our two test sets, which leaves us with some confidence that it would work in other contexts as well.
On a final note, I’d like to add that this project is close to my heart for personal reasons. Three years into graduate school I was sent to Iraq and a big part of my job was to predict IEDs. It was very difficult, for various reasons. Difficult even though we had access to resources that won’t come to American universities anytime soon, including more detailed SIGACTs and event information. One of the challenges was in assessing the effect of various indicators, i.e. multivariate analysis, which is something much easier to do in the quantitative world. So even though the information we have is limited, I’m excited to see how well our effort will turn out.