Random walk negative binomial model for persistent count series.
Tags:
#Bayesian
#Iraq
#Random Walk Negative Binomial
#Time-Series Event Count
Will Moore, Kentaro Fukumoto, and I have been working on a random walk negative binomial model for time-series of counts, based on earlier work by Kentaro on a negative binomial integrated (NB I(1)) model. We just presented a related poster in which we look at monthly civilian deaths in Iraq at Peace Science in Savannah, Georgia. Here is the actual pdf poster (it’s a big file, be warned), but the basic point is that ARIMA or classical count-models are not a good way to deal with time-series of counts, like monthly deaths in a conflict, and that we have a tested model for non-stationary counts that has some attractive features.
We are working on a draft paper, so I don’t want to go through the whole story, but if you’d like to try it out yourself and know how to use JAGS, all the R and JAGS code is available on github.
Basically we are using a state-space model which consists of two separate equations: (1) a state transition equation that models a latent system state and describes how that latent state changes over time, and (2) a measurement equation that describes the process by which we observe actual outcomes (y) at any given time point. As a result, this model separates error in the temporal process that creates our data from the measurement error with which we observe it. An implication is that you can have covariates in either equation, where variables in the state transition equation have effects that propagate through time, i.e. short and long-run effects, while variables entering the measurement equation only have an instantaneous impact for that measurement period.
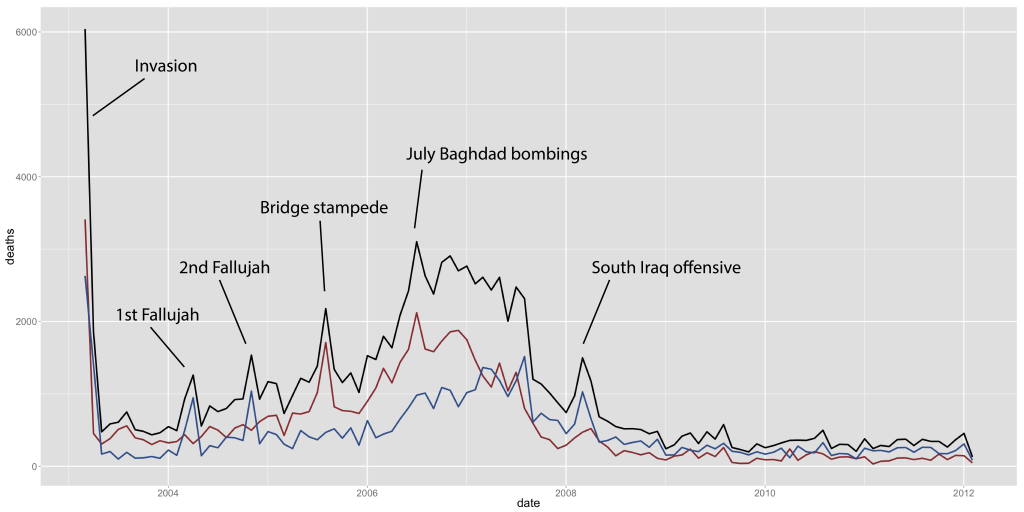
Monthly Iraqi civilian deaths (black=total, red=Baghdad, blue=rest of Iraq).
We’ve tested this model against simulated data we create, and replication code for these simulations is included as well. For an empirical application, I ran the model against some data on Iraqi civilian deaths from the Iraq Body Count that I was working on earlier. The graph on the right shows the monthly civilian deaths in Iraq we are working with. The black line shows totals, and red and blue show deaths in Baghdad and the rest of Iraq respectively. I’ve highlighted some the of the spikes in deaths, like during the invasion or government offensives.
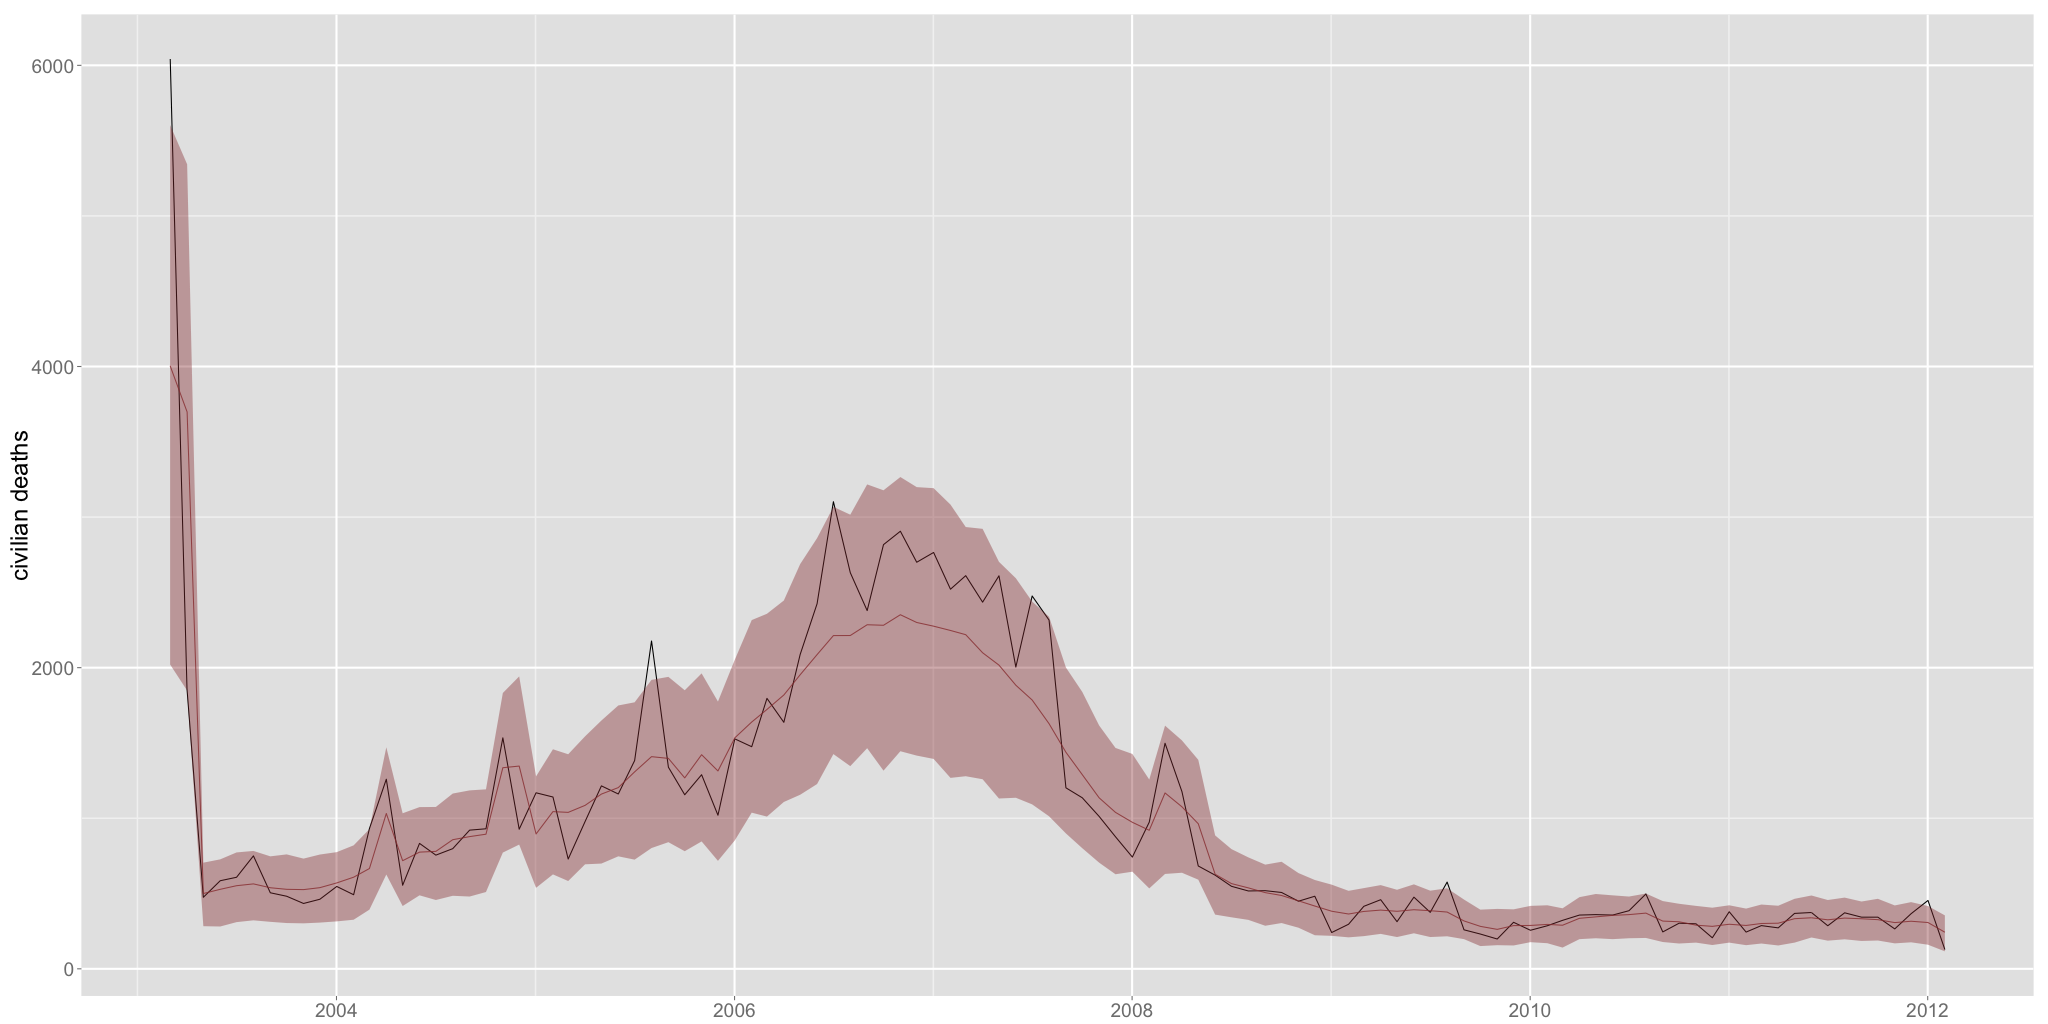
Random walk negative binomial fitted values for Iraq monthly civilian deaths. In-sample fitted values (red) and observed civilian deaths (black). The red band shows 80% interval.
We estimated a very basic random walk negative binomial model for total monthly civilian deaths, with four binary indicators for the initial invasion period, elections, government offensives, and Ramadan. The in-sample model fit is in the graph on the right. I think this is a pretty amazing fit considering how simple this model is, and the mean predicted values seem to be a pretty good reflection of local levels at any given time. At this stage I would feel fairly confident in using this for hypothesis testing, but fore forecasting it would be nice to have a more explicit temporal structure, e.g. running estimates of trends and changes in trends.