Scale and north arrow for maps in R
Tags:
#Bosnia
#Map Scale
#North Arrow
#R
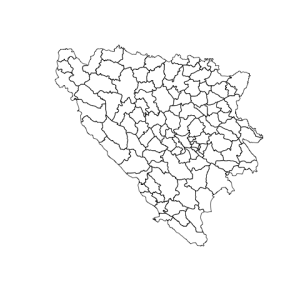
A few months ago I produced some thematic maps of Bosnia (paper) using maptools and other packages in R, but I didn’t include scales or a north arrow. It sounds simple and sp has functions for doing those things, but I couldn’t get it to work well with my maps. Here is a basic map of Bosnia’s pre-war municipalities:
library(maptools)

plot(bosnia)
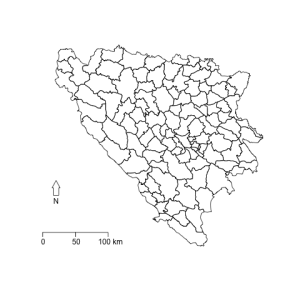
The function map.scale() from the maps package adds a scale. The position is in map units, latitude/longitude in this case:
library(maps)
map.scale(x=15.5, y=42.75, ratio=FALSE, relwidth=0.2)
And GISTools north.arrow for the north arrow. Units are also in map units. This package has a map scale function as well, which looks nicer but is a little bit more complicated to set up.
library(GISTools)
north.arrow(xb=15.75, yb=43.25, len=0.05, lab="N")
This will produce the following map:
Adding these to a function I wrote for producing thematic maps of Bosnia produces this pretty nice map (with scale and north arrow!) of document per capita civil war deaths:
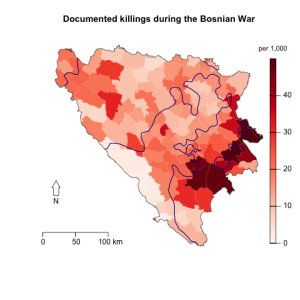
Here is the function (which is pretty specific to the data I use):
ThematicMap <- function(vector, breaks, title, legend) {
  require(maptools)
  require(shape)
  require(RColorBrewer)
  require(GISTools)
  require(maps)

  plotvar <- unlist(vector)
  nclr <- 9
  plotclr <- brewer.pal(nclr, "Reds")
  fillRed <- colorRampPalette(plotclr)
  plotvar[plotvar >= maxy] <- maxy -1
  colcode <- fillRed(maxy)[round(plotvar) + 1]
  plot(bosnia, col = colcode, lty = 0, border = "gray")
  plot(bosnia.st, add=TRUE, lwd=1, border = "gray30")
  plot(bosnia.front93, add = TRUE, lty="solid", lwd=1.5, col="darkblue")
  map.scale(x=15.5, y=42.75, relwidth=0.2, ratio=FALSE)
  north.arrow(xb=15.75, yb=43.25, len=0.05, lab="N")
  title(main = title)
  colorlegend(posy = c(0.05,0.9), posx = c(0.9,0.92),
  col = fillRed(maxy),
  zlim=c(0, maxy), zval = breaks,
  main = legend,
  main.cex = 0.9)
  par(bg='white')
}

killed.pk <- (killed/pop91*1000)
maxy <- 50
breaks <- c(0, 10, 20, 30, 40, Inf)
png("images/map_dead.png")
print(ThematicMap(killed.pk,breaks,"Documented killings during the Bosnian War","per 1,000"))
dev.off()