Yugoslavs die less
Tags:
#Bayesian
#Bosnia
#Research
#Spatial
In 1991 a census was conducted in Bosnia and Herzegovina, which then was still part of the disintegrating federal state of Yugoslavia. Bosnia was the most diverse republic in the former Yugoslavia, with significant populations of Bosnian Muslims (or Bosniaks, 43 percent), Serbs (31 percent), Croats (17 percent), and others. Bosniaks, Serbs, and Croats were more or less well-established identities with historical roots. Unlike in most multiethnic countries however, the census respondents also had the option to identify themselves as Yugoslavs, rather than a particular ethnic or national group. It turns out that this played an interesting role in the way violence occurred in the Bosnian War from 1992 to 1995.
The term Yugoslav came about sometime in the 19th century while the Ottoman Empire still ruled the Balkans, and was associated with attempts to unite all South Slavs in the Balkans (i.e. Croat, Muslim, Serb, and at some point Bulgarians). The Kingdom of Serbs, Croats, and Slovenes, which had formed in the aftermath of World War 1, was renamed Yugoslavia in 1929 after imposition of a royal dictatorship. It was explicitly used in a way opposed to nationalism.
After World War 2 the communists also used the name and technically every citizen of Yugoslavia was a Yugoslav. But six traditional nationalities, Serb, Croat, Slovene, Montenegrin, Macedonian, and Muslim (by nationality), were officially recognized and most people identified with those or other ethnic minorities. The concept of a Yugoslav was kind of a nascent nationalism, similar to the way Bavarians and Saxons eventually came to identify as Germans and the way people from Virginia or Massachusetts eventually came to see themselves as American. Just not quite that accepted.
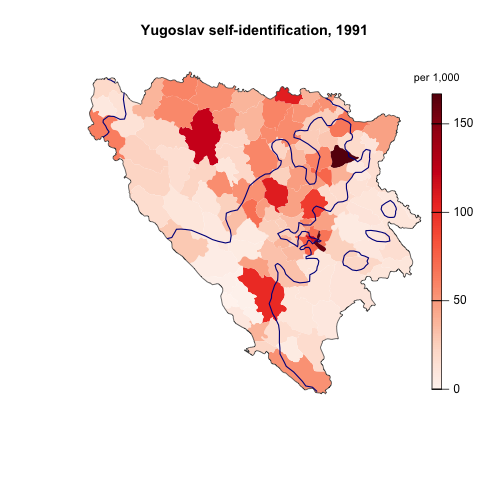
In the 1991 census 5 percent of people in Bosnia choose to identify themselves as Yugoslav, the highest percentage in any of the former Yugoslav republics. The map not he right shows the percentage of Yugoslavs in each of the 109 pre-war municipalities. It was highest in parts of Sarajevo and Tuzla, upwards of 15 percent, and lower in rural areas in the south and east. The blue line on the map shows the approximate 1993 front lines during the war by the way. (The R code for this map is originally from Diego Valle-Jones.)
For ethnic conflict research this is pretty nice since in a way it is a direct measure of anti-nationalist sentiment: you could either identify as a member of your particular ethnic group (or nationality as it was used there), or as a Yugoslav, someone associated with the federal state encompassing all the nationalities. Most people who did so probably had married across ethnic lines or were children who did not fit quite into the traditional ethnic categories (like one of my parents), as well as communists and anti-nationalist idealists. Either way, if extreme nationalism is what leads to violence and “ethnic conflict”, then we should expect to see less violence in areas with low nationalist sentiment, i.e. high Yugoslav identification.
This is a pretty particular argument specific to Bosnia and other Yugoslav republics. Conflict research in studies examining more countries than that typically use a summary measure of ethnic diversity that is more generalizable. The most common one is the ethnolinguistic fractionalization index, with ranges from 0 to 1. Higher values indicate more diversity (technically, the chance that two randomly picked individuals will belong to different ethnic groups), and usually are expected to increase the potential for violence.
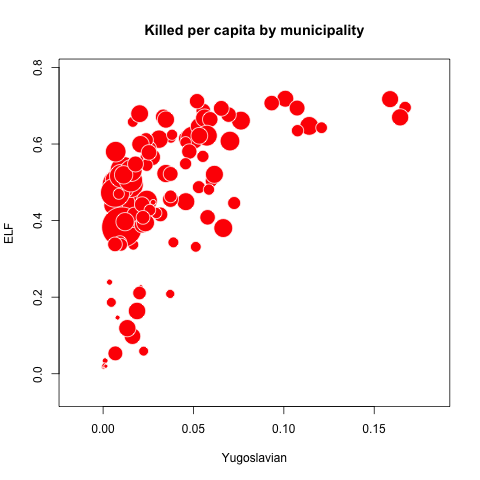
The same index can be calculated for the 109 municipalities in Bosnia. The bubble chart on the right shows the relationship between this ethnic diversity index, Yugoslav self-identification, and violence. Each red circle is one of the municipalities, with it’s diversity score on the y-axis (ELF), and proportion of self-identified Yugoslavs on the x-axis. Why are there no circles on the bottom right quarter of the plot? Few people identified as Yugoslavs in ethnically homogenous municipalities. In ethnically mixed municipalities (the top half of the chart), there is more variation in how many Yugoslavs there were. So there were some municipalities that were ethnically diverse but where few people thought of themselves as Yugoslav. We might call these “nationalist” municipalities. In others a lot of people identified as Yugoslav.
Now consider that the area of each circle is proportional to the number of deaths per 1,000 in that municipality during the war from 1992 to 1995 (data is from the Research and Documentation Center). Few people died in areas where one ethnic group clearly dominated. In ethnically diverse places, the death rate was highest in “nationalist municipalities”, and much lower in “Yugoslav” municipalities.
One should be careful to infer anything about causes here, especially since the census was conducted a few months before war broke out. It may be that in places where there was a lot of tension, people choose to respond to the census as non-Yugoslavs. Still, it’s a pretty interesting pattern and shows that although ethnic diversity can be associated with high violence, it doesn’t necessarily have to.
I’ve been looking into this stuff as part of my dissertation, and it’s part of a paper you can find here.